On this page
Storage is where malware waits. A blob uploaded to ingest/ by a pipeline step, a partner’s SFTP connector, or a misconfigured Logic App sits quietly until something downstream opens it — a Data Factory copy, a Function app, a Synapse notebook, a developer’s az storage blob download. The upload puts the round in the chamber; the retrieval is where it fires. For years the answer was “run AV on whatever reads it,” which is useless when the reader is a headless build runner with no EDR.
Defender for Storage Malware Scanning closes that gap. Every PutBlob triggers a scan inside the storage service itself. The scan runs asynchronously — the blob is readable during scanning, so this is not a hard upload-blocker — but the verdict lands on the blob as an index tag fast enough that downstream consumers can gate on it before opening the file, and a Defender for Cloud alert fires for the SOC. (For workflows that genuinely need the blob to be unreachable until clean, pair the scan with Microsoft’s soft-delete quarantine for malicious blobs or with data-plane ABAC rules that refuse access to blobs without a No threats found tag.) I wanted to measure two things:
- How fast is “scan on upload” in practice?
- What does the full Sentinel story look like — the malware alert alone, or can you layer correlation on top?
What I measured
Uploading EICAR to a freshly-deployed lab storage account on the MSFT tenant:
| Event | Time (UTC) | Δ from upload |
|---|---|---|
az storage blob upload returns | 17:40:35 | 0 s |
Blob index tag Malware Scanning scan result: Malicious | 17:40:38 | +3 s |
Defender alert Storage.Blob_AM.MalwareFound raised | 17:40:39 | +4 s |
Alert visible in Sentinel SecurityAlert table | 18:14:18 | (see below) |
| Scheduled Rule 1 fires on the alert | next 5-min poll | ~5 min |
Microsoft’s docs say “typically within 2 minutes.” For small blobs the hot path can be over an order of magnitude faster. In this lab, the 30-minute gap between the alert being raised and it showing up in Sentinel was caused by the missing export path described below — worth checking early in your own setup. See Sentinel ingestion — the step worth verifying below.
Hands-on Lab: All Bicep, Sentinel rules, attack scripts, and the workbook are in the companion repo on GitHub.
Why storage is a blind spot
A fast inventory of real-world attack patterns I’ve seen against blob storage in the last year:
- Phishing staging — attacker gets temporary SAS access, drops a malicious Excel or LNK into a public-ish container, mails the URL to employees. Recipients click, the browser downloads direct from the company’s own
*.blob.core.windows.netdomain, and neither Defender for Office nor any endpoint AV flags the storage-side artifact before open. - Supply chain payload stash — an attacker who’s already in CI drops a dropper into a container that a downstream build job fetches. The dropper is fetched by the build runner with a managed identity; the build runner has no EDR.
- Anonymous backup theft — a container left
allowBlobPublicAccess=trueby mistake. Backups, training data, or cached credentials get crawled by the usual scanners. - Cross-tenant data drop — a compromised B2B guest has Contributor rights to a shared account. Used for exfil on the way out.
The common thread: the storage layer itself has no idea what it’s holding. Everything downstream inherits that problem.
What Defender for Storage Malware Scanning actually does
Two sub-capabilities are worth separating:
- OnUpload Malware Scanning — on every
PutBlob/PutBlockList, the storage service hashes the blob, runs it through a Microsoft-maintained scan engine (the same one backing Defender for Endpoint), and tags the result. - Activity monitoring — unusual access patterns (anonymous from the internet, access from TOR exit nodes, sudden data egress) raise Defender alerts independent of the malware scan.
Key constraints worth internalizing before committing budget:
- Per-account — enablement is per storage account, not per container.
- File size cap — 50 GB per blob at current Microsoft Learn limits. The documented tag values are
No threats found,Malicious,Error, andNot scanned— plusScan timed outfor blobs that exceed Defender’s 30 min–3 hr scan window. Alert on the non-No threats foundstates too, not justMalicious. - Supported services — on-upload scanning covers Blob storage and ADLS Gen2; Queues and Tables are not in scope. On-demand scanning is a separate feature that covers blobs and (in recent previews) Azure Files as well.
- Result delivery channels — four options ship with the feature: blob index tags (default, what this lab uses), Defender for Cloud alerts, Event Grid events, and an opt-in
StorageMalwareScanningResultsLog Analytics table for a durable audit trail. Pick whichever matches your use case: tags for downstream gating, alerts for SOC workflow, Event Grid for real-time automation, the LA table for compliance/forensics. - Cost model — $0.15 per GB scanned, charged from the first byte (there is no free tier despite older previews hinting at one — verify against the current pricing page before you commit to an uncapped deployment). Plus the base Defender for Storage Standard plan at roughly $10/account/month prorated.
- Result tag naming — the tag keys are literally
"Malware Scanning scan result"and"Malware Scanning scan time UTC"— with spaces. Plan for this when writing the blob-index-tag query that gates downstream consumers.
Architecture
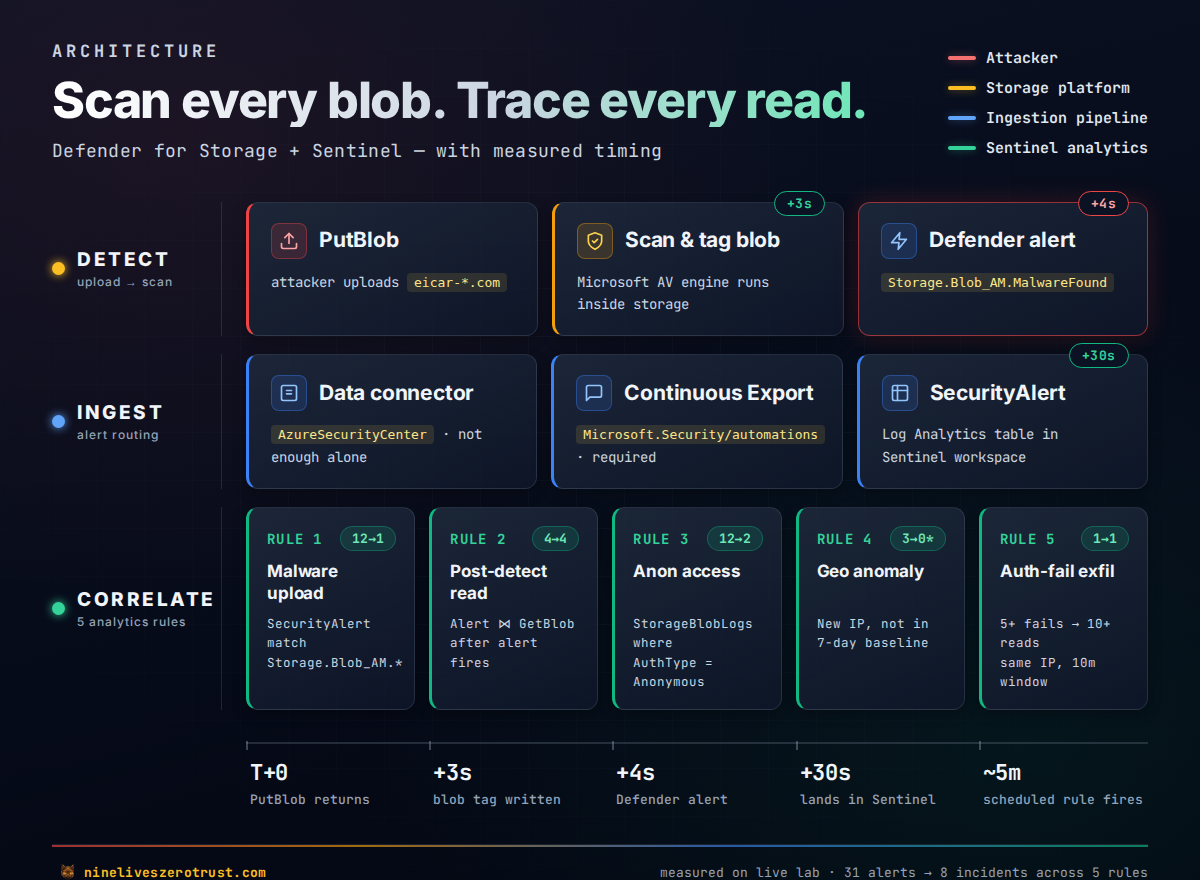
Two things are worth calling out on this diagram. First, the Ingest row has two nodes for a reason: in the tenant I tested, the Sentinel data connector by itself didn’t move alerts into SecurityAlert — enabling Continuous Export as well was what actually populated the table. Microsoft’s own docs are inconsistent on whether the connector alone is enough (see the next section), so validate your own tenant path with a fresh detection, especially if you also have the unified Defender XDR connector in play. Second, the Correlate row shows why this is worth standing up at all: the same StorageBlobLogs diagnostic stream that powers access logging is what lets you correlate a malware detection against the reads that followed it. That’s the difference between “we detected malware” and “we detected malware and three IPs pulled it before quarantine ran.”
Sentinel ingestion — the step worth verifying
This one cost me 45 minutes of staring at an empty SecurityAlert table. Every Microsoft Sentinel tutorial for Defender for Cloud alerts says “enable the data connector.” I did. The UI tile flipped green. Zero alerts arrived. Meanwhile, Microsoft.Security/alerts (the Defender for Cloud API) had the alert sitting right there.
Root cause in the tenant I tested: the AzureSecurityCenter data connector flipped its state in Sentinel’s UI but did not actually move alerts into SecurityAlert on its own. A Defender for Cloud Continuous Export automation pointed at the workspace was what finally populated the table. Microsoft’s own docs are a bit inconsistent on this — the Sentinel connector guide implies the connector ingests alerts into SecurityAlert, while the Defender for Cloud export docs describe Continuous Export as the mechanism that populates SecurityAlert and SecurityRecommendation. The safe guidance for real deployments, based on the behavior I saw, is to enable both and verify with a fresh detection that rows actually appear. This is especially worth checking in tenants that also have the unified Defender XDR connector enabled, which changes the routing again.
Lab configuration I validated:
# 1. Sentinel data connector (required; surfaces the connector in the UI)
az rest --method PUT \
  --url "https://management.azure.com/subscriptions/<sub>/resourceGroups/<rg>/providers/Microsoft.OperationalInsights/workspaces/<ws>/providers/Microsoft.SecurityInsights/dataConnectors/defender-for-cloud?api-version=2023-02-01" \
  --body '{"kind":"AzureSecurityCenter","properties":{"subscriptionId":"<sub>","dataTypes":{"alerts":{"state":"Enabled"}}}}'

# 2. Continuous Export automation (what populated SecurityAlert in this lab)
az rest --method PUT \
  --url "https://management.azure.com/subscriptions/<sub>/resourceGroups/<rg>/providers/Microsoft.Security/automations/defender-alerts-to-sentinel?api-version=2023-12-01-preview" \
  --body '{
    "location": "<region>",
    "properties": {
      "isEnabled": true,
      "scopes":  [{"scopePath": "/subscriptions/<sub>"}],
      "sources": [{"eventSource": "Alerts"}],
      "actions": [{"actionType": "Workspace", "workspaceResourceId": "<workspace-id>"}]
    }
  }'
In this lab, deploying both made new Defender alerts start landing in SecurityAlert within ~30 seconds rather than not at all. The automation is forward-only — it doesn’t backfill — so alerts that existed before you created it stay in the Defender API but never reach Log Analytics. If you’re backfilling, re-trigger the detection (for this lab, just upload another EICAR).
The companion repo’s deploy-lab.sh does both in a single step. This was easily the single most useful thing I learned building this lab, and it is worth validating anywhere you rely on Defender for Cloud alerts in Sentinel.
Deploy the lab
Everything is Bicep. The plan-level enablement is a subscription resource so the deploy script does it via az rest before the Bicep runs.
git clone https://github.com/j-dahl7/defender-storage-malware-sentinel.git
cd defender-storage-malware-sentinel/scripts
SUBSCRIPTION=<sub-id> LOCATION=eastus2 ./deploy-lab.sh
The script:
- Switches the subscription’s Defender for Storage plan from Free to
Standard+DefenderForStorageV2, with theOnUploadMalwareScanningextension enabled. - Creates
storage-malware-lab-rgand deploysinfra/main.bicep— a storage account, three containers (ingest/processed/quarantine), StorageBlobLogs diagnostics wired to the Sentinel workspace, and a per-accountDefenderForStorageSettingsresource that overrides the subscription plan for this specific account. - Deploys
infra/sentinel-rules.bicep— five scheduled analytics rules. - Publishes the workbook.
The per-account override in Bicep looks like this:
resource malwareScanning 'Microsoft.Security/DefenderForStorageSettings@2022-12-01-preview' = {
  name: 'current'
  scope: storage
  properties: {
    isEnabled: true
    malwareScanning: {
      onUpload: { isEnabled: true, capGBPerMonth: 5 }
      scanResultsEventGridTopicResourceId: null
    }
    overrideSubscriptionLevelSettings: true
  }
}
capGBPerMonth is the cost cap. In a production account you want this bounded — a misconfigured pipeline that dumps a petabyte into ingest/ will otherwise hand you a five-figure scan bill.
Attack 1: EICAR baseline
EICAR is the industry-standard “safe malware” test string — most AV engines flag it, and it doesn’t do anything. Perfect for a dev tenant.
export STORAGE_ACCOUNT=stmalwr<suffix>
./attacks/upload-eicar.sh
The script uploads two blobs: eicar-<timestamp>.com (the AV test pattern, base64-encoded to survive shell escaping) and readme-<timestamp>.txt (a harmless negative control).
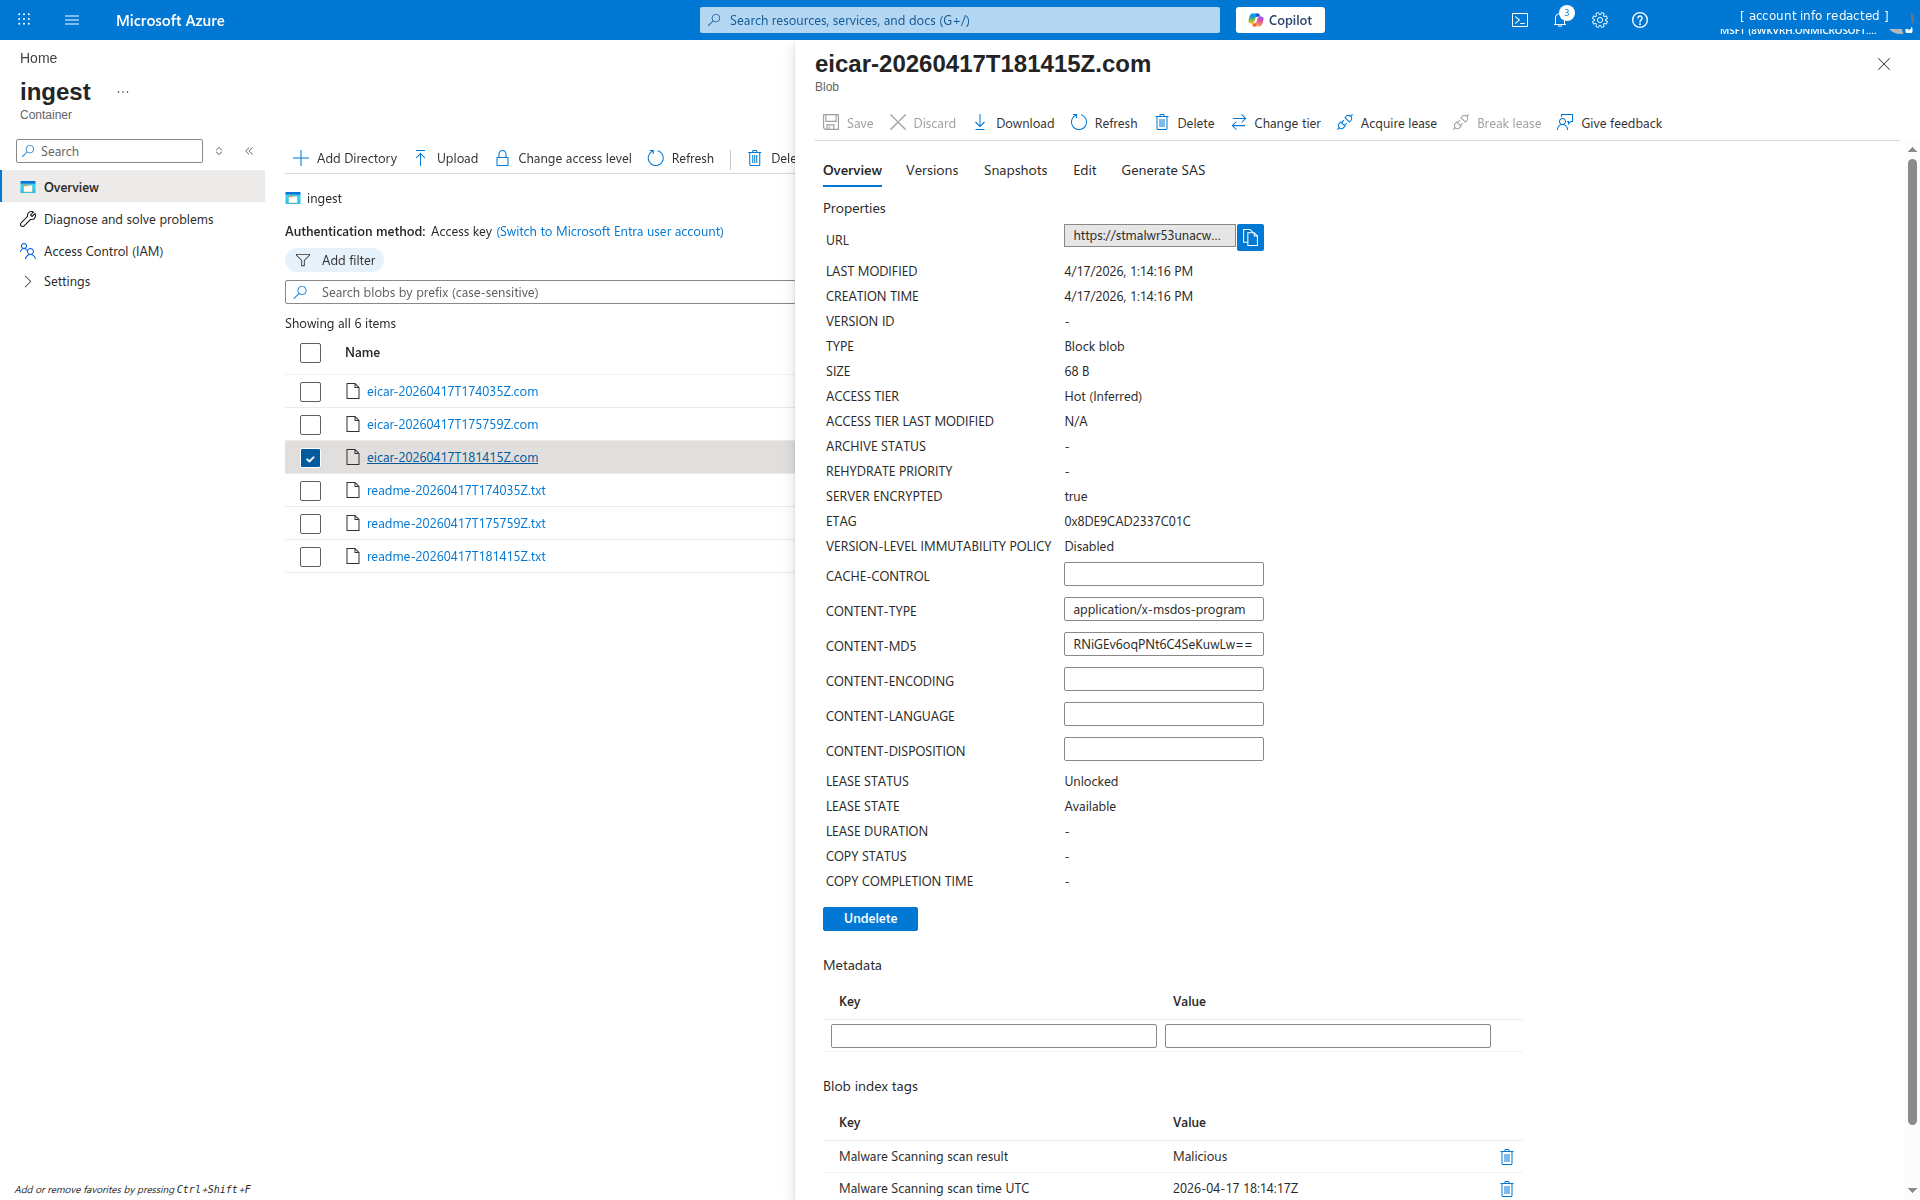
Query the blob to confirm the scan result:
$ az storage blob tag list --account-name stmalwareexample \
    --container-name ingest --name "eicar-20260417T174035Z.com" \
    --auth-mode login
{
  "Malware Scanning scan result": "Malicious",
  "Malware Scanning scan time UTC": "2026-04-17 17:40:38Z"
}

$ az storage blob tag list --account-name stmalwareexample \
    --container-name ingest --name "readme-20260417T174035Z.txt" \
    --auth-mode login
{
  "Malware Scanning scan result": "No threats found",
  "Malware Scanning scan time UTC": "2026-04-17 17:40:38Z"
}
Both blobs scanned at the same second. The clean one got a benign verdict; EICAR got the malicious verdict.
The Defender alert payload
The alert itself carries more than just “something’s wrong”:
AlertType:    Storage.Blob_AM.MalwareFound
Display:      Malicious blob uploaded to storage account
Severity:     High
Entities:     azure-resource (the storage account)
              filehash
              file (blob name)
              malware (Virus:DOS/EICAR_Test_File)
              blob-container (ingest)
              blob (blob name again)
Entity-rich. The malware entity carries the threat-intel family name (Virus:DOS/EICAR_Test_File in this case); for real malware it’ll be the Microsoft Defender family name and so is usable for correlation against Defender for Endpoint detections elsewhere in your estate.
Attack 2: anonymous access probe
The account is deployed with allowBlobPublicAccess=false, which ought to make anonymous reads impossible. Worth verifying — attackers poke storage accounts all day looking for the one that was misconfigured.
./attacks/simulate-anon.sh
Issuing anonymous requests against stmalwareexample/ingest
  [409] https://stmalwareexample.blob.core.windows.net/ingest?restype=container&comp=list
  [409] https://stmalwareexample.blob.core.windows.net/ingest/readme.txt
  [409] https://stmalwareexample.blob.core.windows.net/ingest/config.json
  [409] https://stmalwareexample.blob.core.windows.net/ingest/.env
  [409] https://stmalwareexample.blob.core.windows.net/ingest/backup.sql
Worth noting: the responses are 409 PublicAccessNotPermitted, not 403 AuthenticationFailed. That matters for KQL filtering — if you’re writing a rule on “403 storms”, you’ll miss the cleanest anonymous-probe signal. Rule 3 below looks for AuthenticationType == "Anonymous" rows in StorageBlobLogs instead of keying off HTTP status.
Sentinel analytics rules
Five rules, all using the union isfuzzy=true fallback pattern so they validate against an empty table before real data arrives. Full Bicep is in infra/sentinel-rules.bicep.
Rule 1 — Malicious file uploaded to blob storage
union isfuzzy=true
  (datatable(TimeGenerated:datetime, AlertName:string, AlertSeverity:string, ProductName:string, Entities:string, AlertLink:string, CompromisedEntity:string)[]),
  (SecurityAlert
    | where ProductName =~ "Microsoft Defender for Cloud"
    | where AlertType startswith "Storage.Blob_AM"
  )
| project TimeGenerated, AlertName, AlertSeverity, AlertType, CompromisedEntity, Entities, AlertLink
Note the filter is startswith "Storage.Blob_AM" — the actual alert type emitted by the service is Storage.Blob_AM.MalwareFound, not Storage.Blob_MalwareUploaded or any of the other plausible guesses. I initially wrote the rule against the latter, deployed it, uploaded EICAR, and got crickets. Always check the raw alert before finalizing your rule filters.
Severity: High. Creates an incident. Grouping (matchingMethod: Selected, groupByAlertDetails: [DisplayName]) collapses every Rule 1 alert into a single open incident — I verified this live against SecurityIncident: 12 Rule 1 firings across two distinct EICAR uploads all rolled into a single open incident. That’s the intended behavior, but worth knowing: if you need per-file incidents, switch the grouping method to AllEntities and include the blob entity, like Rule 2 does below.
Rule 2 — Post-detection blob read on infected file
This is the rule that turns a single malware alert into an incident with actual blast-radius information:
let storageAccount = "__STORAGE__";
let alerts =
  union isfuzzy=true
    (datatable(TimeGenerated:datetime, BlobUrl:string, AlertName:string)[]),
    (SecurityAlert
      | where ProductName =~ "Microsoft Defender for Cloud"
      | where AlertType startswith "Storage.Blob_AM"
      | extend ent = parse_json(Entities)
      | mv-expand ent
      | where tostring(ent.Type) == "blob"       // not "file" — the file entity has an empty Url
      | extend BlobUrl = tostring(ent.Url)
      | project TimeGenerated, BlobUrl, AlertName
    );
alerts
| join kind=inner (
    StorageBlobLogs
    | where AccountName =~ storageAccount
    | where OperationName == "GetBlob"
    | where StatusText in ("Success", "SuccessWithThrottling")
    | extend BlobUrl = replace_string(tostring(Uri), ":443", "")  // logs include :443; the alert Url does not
    | project ReadTime=TimeGenerated, BlobUrl, CallerIpAddress, UserAgentHeader, StatusText
) on BlobUrl
| where ReadTime > TimeGenerated
| summarize Reads=count(), Callers=make_set(CallerIpAddress, 25), UserAgents=make_set(UserAgentHeader, 10)
    by BlobUrl, AlertName, bin(TimeGenerated, 5m)
Two traps in this rule that the preview version of this post walked straight into:
- The
fileentity has an emptyUrlonStorage.Blob_AM.MalwareFound. The blob name lives there, but the actual URL is on the separateblobentity — so you have tomv-expandand filter onType == "blob", not"file", or the join evaluates to zero rows. StorageBlobLogs.Uriincludes:443(e.g.https://foo.blob.core.windows.net:443/ingest/file.ext), but theblobentity’sUrldoes not. Withoutreplace_string(Uri, ':443', ''), the string equality in the join never matches.
The logic: parse the Entities JSON out of each malware alert, pull the blob URL from the blob entity, join against StorageBlobLogs GetBlob events on the normalized URL, and keep only reads that happened after the alert fired. Any row that comes out is a post-detection retrieval to investigate.
Severity: High. Creates an incident. This rule uses matchingMethod: AllEntities so each distinct combination of blob-url + caller-set produces its own incident, rather than collapsing under the display name the way Rule 1 does.
Rule 3 — Anonymous access attempt
let storageAccount = "__STORAGE__";
StorageBlobLogs
| where AccountName =~ storageAccount
| where AuthenticationType == "Anonymous"
| summarize Attempts=count(), Operations=make_set(OperationName, 10),
            Blobs=make_set(Uri, 25)
    by CallerIpAddress, bin(TimeGenerated, 5m)
| where Attempts > 0
AuthenticationType == "Anonymous" catches probe traffic whether the response was 409 (public access disabled) or 200 (somebody accidentally flipped allowBlobPublicAccess). Either way, Sentinel gets to see the caller IP and the paths being guessed — useful for threat intel on what the scanners are probing for.
Rule 4 — Geo-anomalous caller
Baseline the last 7 days of caller IPs against the storage account. Anything new shows up as a hit:
let storageAccount = "__STORAGE__";
let baseline =
  StorageBlobLogs
  | where AccountName =~ storageAccount
  | where TimeGenerated between (ago(7d) .. ago(1h))
  | extend IP = tostring(split(CallerIpAddress, ":")[0])
  | summarize by IP;
StorageBlobLogs
| where AccountName =~ storageAccount
| where TimeGenerated > ago(1h)
| extend IP = tostring(split(CallerIpAddress, ":")[0])
| where isnotempty(IP) and IP !in (baseline)
| summarize Ops=count(), Operations=make_set(OperationName, 10), Blobs=make_set(Uri, 25)
    by CallerIpAddress=IP
Two implementation notes:
CallerIpAddressincludes source port — e.g.,10.0.0.1:54321. You must split on:to aggregate by IP.- Baselines cost query time — I run this one at
queryFrequency: PT1H, queryPeriod: P7D. Running it faster than hourly is throwing money at the Log Analytics query engine for no added signal.
This rule is deliberately deployed as “notification only” (no incident) — the false-positive rate on net-new IPs is high, but it pairs well with Rule 1 as incident-enrichment context in Sentinel’s investigation view.
Rule 5 — Bulk download after auth failures
The credential-spray-to-exfil pattern:
let storageAccount = "__STORAGE__";
let fails =
  StorageBlobLogs
  | where AccountName =~ storageAccount
  | where TimeGenerated > ago(15m)
  // Authorization* catches AuthorizationError, AuthorizationFailure,
  // AuthorizationPermissionMismatch — the three real shapes Azure Storage
  // produces for an authenticated-but-unauthorized call.
  | where StatusText startswith "Authorization" or StatusText in ("AuthenticationFailed", "Forbidden")
  | extend IP = tostring(split(CallerIpAddress, ":")[0])
  | summarize FailCount=count(), FailLast=max(TimeGenerated) by IP
  | where FailCount >= 5;
fails
| join kind=inner (
    StorageBlobLogs
    | where AccountName =~ storageAccount
    | where OperationName == "GetBlob"
    | where StatusText in ("Success", "SuccessWithThrottling")
    | extend IP = tostring(split(CallerIpAddress, ":")[0])
    | summarize Reads=count(), ReadFirst=min(TimeGenerated) by IP
    | where Reads >= 10
) on IP
| where ReadFirst between (FailLast .. FailLast + 10m)
| project IP, Reads, FailCount, FailLast, ReadFirst
Five or more authentication failures from the same IP, followed by ten or more successful GetBlobs from that same IP within 10 minutes, is a credential-guessing-then-exfil pattern. Two things you need to get right, because the preview version of this post got both wrong:
- The real 403 status text is
AuthorizationPermissionMismatch(or sometimesAuthorizationError) — notAuthorizationFailureorForbidden, which is what the REST error-code docs suggest.startswith "Authorization"catches all three shapes in one predicate. - Thresholds are calibrated for a lab. A busy infrastructure scanner will trip
FailCount >= 5alone, so tune both thresholds up for production and seriously consider requiring the successful reads to be on distinct blob paths before declaring exfil.
Workbook
The workbook (infra/workbook.json) surfaces seven panels:
- KPI tiles — detections today, high-severity count, unique accounts flagged, unique files detected.
- Timeline —
Storage.Blob_AM.*alerts over time, split by severity. - Recent malware detections — table with timestamp, alert name, blob URI (from the
blobentity, so the URL actually resolves), compromised entity, alert link. - Top caller IPs (last 24h) — per-IP totals for ops, reads, writes, and failures (using the
Authorization*filter pattern so it actually catches real 403s). - Anonymous access attempts chart — hourly column chart of anonymous-auth rows.
- Caller IP map — public caller IPs plotted geographically, heat-mapped by failure count, so private heartbeats don’t dominate the view.
- Unremediated malicious blobs — a join that surfaces every
Storage.Blob_AM.MalwareFounddetection whose blob is still in a non-quarantine container. This is the actionable view: each row is a file an analyst or playbook still needs to move or delete.
For an SOC analyst triaging a malware alert, panels 3, 4, and 7 together give you “which file, who touched it, and is it still where the adversary can reach it?” on one screen.
Gotchas worth writing down
Things the docs don’t spell out that bit me during the build:
(The single most useful lab finding — that in this tenant the Sentinel data connector alone did not populate SecurityAlert, while adding Continuous Export did — is called out separately above in Sentinel ingestion — the step worth verifying. Treat that as something to validate in your own Defender for Cloud → Sentinel path, especially if Defender XDR integration is enabled.)
- Plan enablement
extensionsarray is strict. The valid extension names are exactlyOnUploadMalwareScanningandSensitiveDataDiscovery. My first PUT included{"name": "Blobs"}(a guess based on old plan names) and got backError converting value "Blobs" to type ...PricingExtensionNames. additionalExtensionProperties: {"CapGBPerMonth": "..."}on the subscription-level extension returnsAdditional property 'CapGBPerMonth' is not supported. The cap lives on the per-accountDefenderForStorageSettingsresource (capGBPerMonthproperty), not on the plan extension. Moving it fixed the deploy.- Alert type naming —
Storage.Blob_AM.MalwareFound, notStorage.Blob_MalwareUploaded/Storage.Blob_MalwareDetected/ any other plausible guess. Pin your filter to the actual string the service emits, or useAlertType contains "Malware". queryPeriodISO format — Sentinel rejectsPT7D. The correct ISO 8601 for “7 days” isP7D(theTis for time components only). The 7-day baseline rule would not deploy until I fixed this.queryPeriod >= 2drequiresqueryFrequency >= PT1H. Sentinel enforces this as a hard validation rule. You cannot have a 7-day baseline running every 30 minutes.- Blob index tag reads require
Storage Blob Data Owner(or theMicrosoft.Storage/storageAccounts/blobServices/containers/blobs/tags/readaction). NeitherContributornorStorage Blob Data Contributoris enough — the tag data-plane permissions are separate. StorageBlobLogs.CallerIpAddressincludes source port (e.g.,10.0.0.1:54321). Alwayssplit(CallerIpAddress, ":")[0]before aggregating by IP.- Anonymous probe responses are
409 PublicAccessNotPermitted, not403. Write rule filters againstAuthenticationType == "Anonymous"rather than HTTP status codes. - A bad SAS token logs as
StatusText: AuthorizationError, not theAuthenticationFailed/AuthorizationFailure/Forbiddenyou might expect from reading the REST error-codes page. Rule 5’shas_any()filter must includeAuthorizationErroror the credential-spray-to-exfil correlation never fires. Also: SAS requests with completely garbage signatures don’t appear to land inStorageBlobLogsat all — the front door drops them before the operation is recognized. To exercise Rule 5 reliably, use a principal with authenticated access that lacks the specific data-plane action you’re testing. Storage.Blob_AM.MalwareFoundalerts include two entities for the blob:file(withName, emptyUrl) andblob(with bothNameand fullUrl). Rule 2’s join key must use theblobentity. If you grab thefileentity you get an empty URL and the join produces zero rows.StorageBlobLogs.Uriincludes the:443port (e.g.,https://foo.blob.core.windows.net:443/ingest/file.ext), but theblobentity’s Url inSecurityAlertdoes not.replace_string(Uri, ':443', '')normalizes the two for joins.
What this closes
- Phishing staging — the malicious artifact is tagged Malicious before the phish arrives, and the tag is queryable by downstream consumers.
- Supply chain drop — a dropper placed in a CI-readable container is flagged before the build runner pulls it. Pair with a data-plane ABAC role assignment that only grants read when the blob’s
Malware Scanning scan resultindex tag equalsNo threats found. (Azure Policy is the wrong tool for this — it enforces management-plane control, but blob reads are a data-plane operation and need data-plane enforcement.) For workflows you can’t gate at read time, Defender’s built-in soft-delete quarantine for malicious blobs is a reasonable compensating control. - Anonymous misconfig — Rule 3 catches the probe traffic even when the account is correctly locked down, so you learn who’s looking.
- Exfil after detection — Rule 2 upgrades the raw alert into an incident only when the blob was actually retrieved post-detection.
What it doesn’t close
- Files > 50 GB — exceed the scanner’s size cap. Write a blob-lifecycle policy that either chunks large uploads into scan-able sizes or gates downstream consumers on
"Malware Scanning scan result" == "No threats found"(rather than !="Malicious") soNot scanned,Error, andScan timed outverdicts don’t silently pass through. - Queues and Tables — out of scope for Defender for Storage Malware Scanning. Queue payloads in particular are a common overlooked surface.
- Azure Files (on-upload) — on-upload scanning isn’t supported for Azure Files. On-demand scanning for Files is available in public preview as of March 2026, so you can scan existing shares manually or on a schedule, but uploads aren’t protected inline.
- Time-of-check / time-of-use — the scan runs on write. A blob that was clean yesterday but whose contents were overwritten with malware today is re-scanned on the new write. A blob that was never re-uploaded after a scan-engine-definition update keeps its original verdict; if you need coverage against engine updates, trigger an on-demand scan over the container rather than assuming Defender rescans automatically.
- Encrypted/protected payloads — client-side encrypted blobs can’t be scanned, and password-protected archives return a
Scan failed - blob is protected by passwordverdict. Both cases leave the content opaque to the scanner, so treat the non-No threats foundtag as the exception rather than trusting the verdict. - Model artifacts with embedded code — pickles, TorchScript, etc. Those need AI-specific controls and alerting; see the Agent 365 Defender playbook for related Defender for AI Services coverage.
Validation — what I saw end-to-end
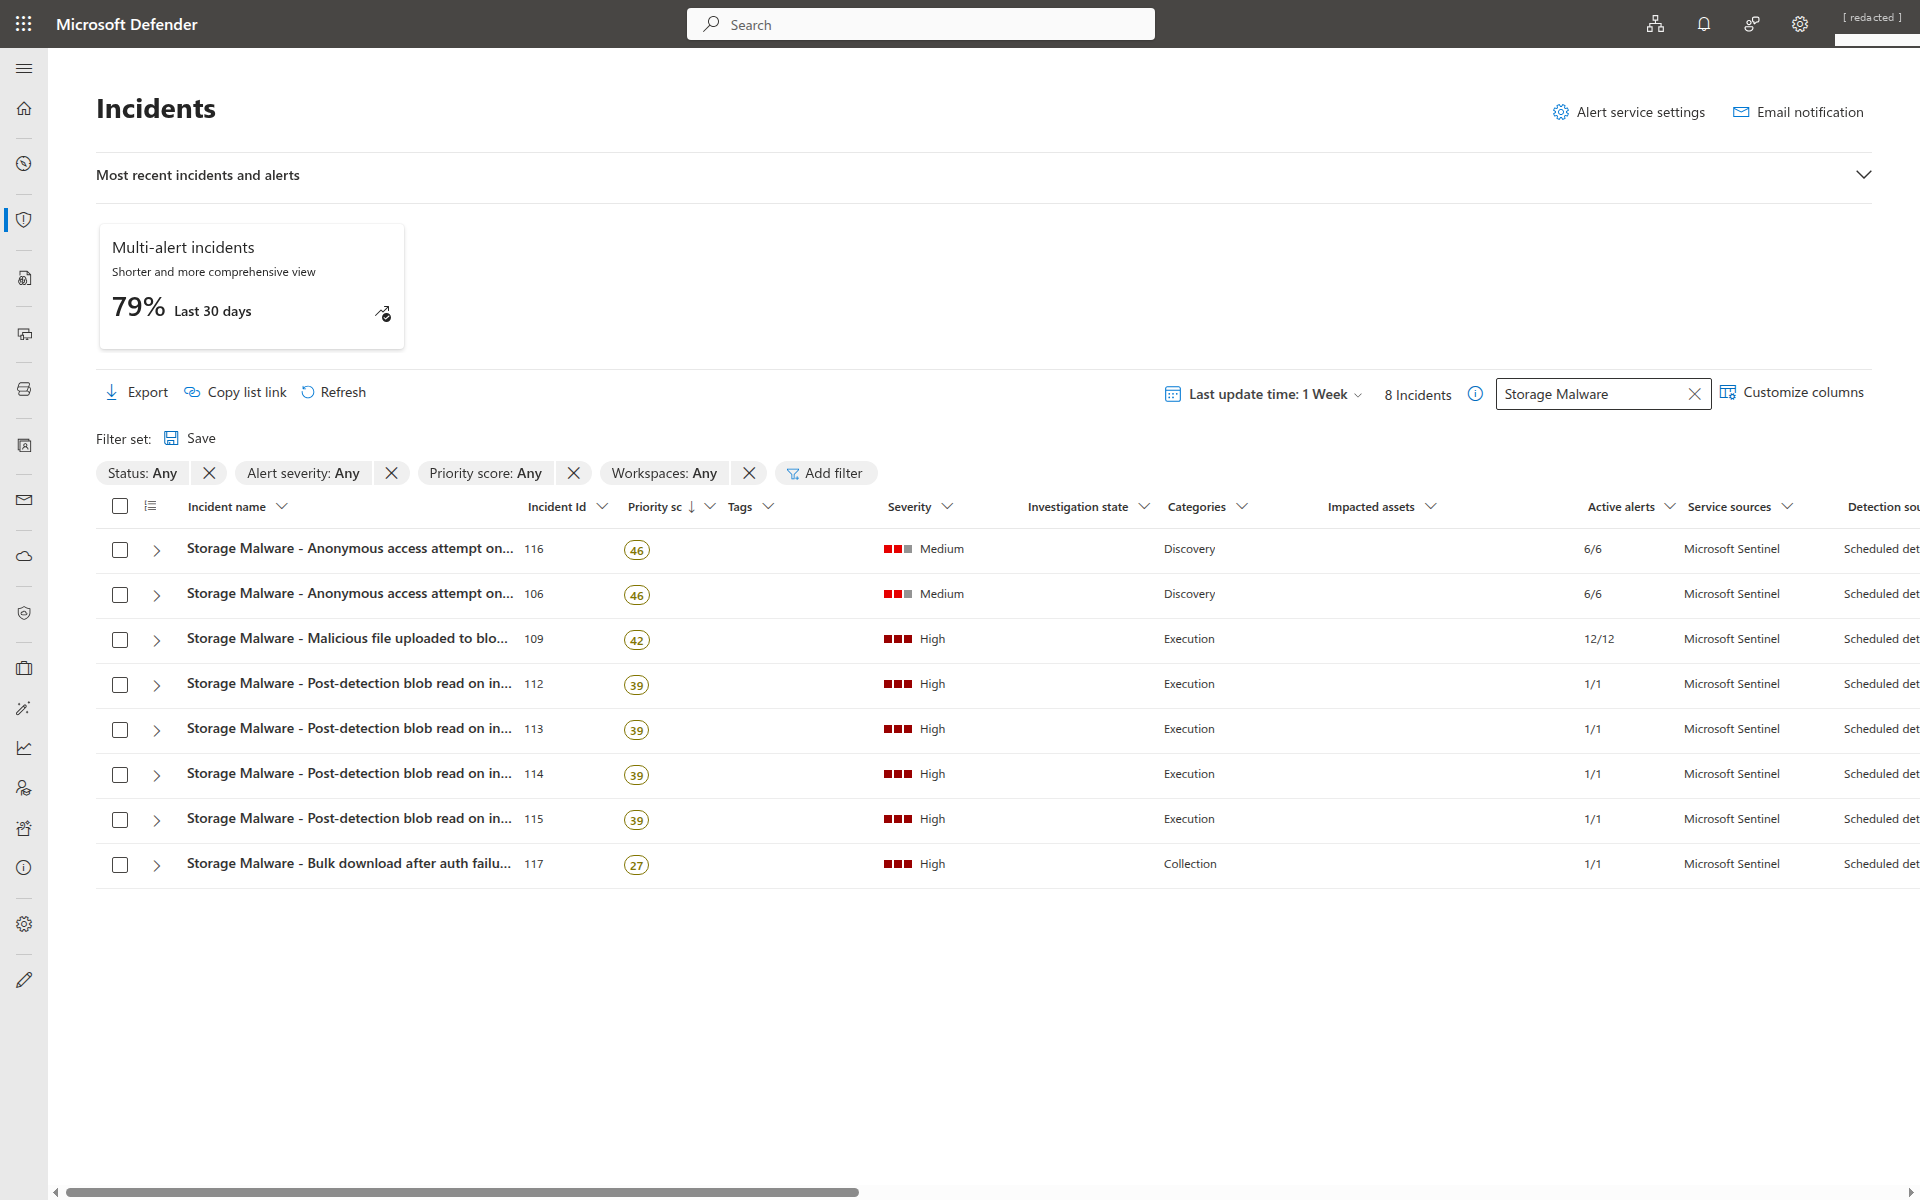
Storage Malware. Eight rows, one per incident: 1 from Rule 1 (12/12 alerts, DisplayName-grouped into one incident), 4 from Rule 2 (AllEntities-grouped, one per blob-caller combo), 2 from Rule 3 (DisplayName-grouped, two buckets), 0 from Rule 4 (notification-only), 1 from Rule 5. Alert totals add to 31 across 8 incidents — the exact grouping ratios the Validation table below claims.Fire counts queried live from the Sentinel workspace on 2026-04-17 after roughly twelve hours of attack traffic (two EICAR uploads with the negative-control readme, two runs of the anonymous probe, a fifteen-blob download burst against the flagged file, and an AuthorizationPermissionMismatch storm from an under-privileged service principal followed by another successful-read burst from the same source IP):
| Rule | Fires | Depends on |
|---|---|---|
| Rule 1 — Malicious file uploaded | 12 | SecurityAlert + Continuous Export |
| Rule 2 — Post-detection blob read | 4 | Rule 1’s alert + StorageBlobLogs.GetBlob |
| Rule 3 — Anonymous access attempt | 12 | StorageBlobLogs.AuthenticationType=Anonymous |
| Rule 4 — Geo-anomalous caller | 3 | StorageBlobLogs + 7-day IP baseline |
| Rule 5 — Bulk download after auth failures | 1 | StorageBlobLogs auth-fail → read pattern |
All five fired end-to-end. Rule 5 was the hardest to exercise: a handful of garbage SAS tokens or stray curls won’t match it, because Azure Storage doesn’t log completely-unauthenticated requests (those die at the front door, before StorageBlobLogs). Authentication must succeed and authorization must fail — which meant standing up a dedicated service principal with Reader on the subscription and no blob data-plane role, authenticating it via OAuth2 client credentials, and having it try GetBlob. Each request logs as AuthorizationPermissionMismatch, and then fifteen successful reads from the same caller IP within ten minutes makes the correlation match.
A few things jumped out running this:
- Two EICAR uploads, twelve distinct Rule 1 firings, one open incident. The rule polls every 5 minutes with a 1-hour lookback, so the same detection re-fires as long as it’s inside the lookback window. Grouping (
matchingMethod: Selected,groupByAlertDetails: [DisplayName]) rolls every one of those firings into the same incident — not one per file, but one per rule — because the display name is constant across firings. I verified this against liveSecurityIncident: all 12 Rule 1 alerts rolled into a single incident. That’s the right behavior for reducing analyst fatigue; if you want per-file incidents, switch toAllEntitiesgrouping with the blob entity. - Rule 2’s first firing lagged the malware alert by ~6 minutes, driven entirely by
StorageBlobLogsingestion (the reads have to land before the join resolves). That’s roughly the minimum time-to-incident on an active exfil pattern using the scheduled-rule model. For a faster gate, lean on blob-index-tag checks at the consumer side instead of Sentinel alone. - Rule 4 baseline quirk: on day zero the baseline (
StorageBlobLogs | where TimeGenerated between (ago(7d)..ago(1h))) is mostly empty, so the rule fires on every new IP. Expect noise in the first week and tighten as the baseline fills out. - Rule 5 took a full authenticated-but-unauthorized principal to exercise — a real mis-configured pipeline looks like this. Bad SAS tokens with garbage signatures don’t cut it, because those are rejected before they reach the logging layer.
Recommended rollout
- Enable the plan subscription-wide (
DefenderForStorageV2withOnUploadMalwareScanning). Per-account opt-out is cleaner than per-account opt-in for compliance reporting. - Set a realistic
capGBPerMonthper account. A low-throughput service account is fine at 50 GB/mo; a data-lake account might need 10 TB/mo. Either way, don’t run uncapped. - Wire Defender alerts into Sentinel and validate with a fresh detection. Enable the
AzureSecurityCenterdata connector on the workspace and aMicrosoft.Security/automationsContinuous Export targeting the same workspace. In my lab, the connector alone showed green but produced zero rows inSecurityAlertuntil Continuous Export was in place; Microsoft’s own docs are inconsistent about which component is load-bearing (see Sentinel ingestion — the step worth verifying). Test by triggering a detection and confirming it lands inSecurityAlertwithin roughly 30 seconds. Continuous Export is forward-only, so re-trigger anything you want backfilled. This is doubly worth testing if your tenant also has the unified Defender XDR connector enabled, which changes the routing. - Deploy the five rules and the workbook against your Sentinel workspace. Start with Rule 1 creating incidents and Rules 2–5 in “enabled, no incident” mode for a soak period so you can understand what your noise floor looks like.
- Write a blob-lifecycle or consumer-side gate that only allows
"Malware Scanning scan result" == "No threats found"— don’t just blockMalicious. Defender also producesNot scanned,Error,Scan timed out, andScan failed - blob is protected by passwordverdicts, plus cases where a blob might not carry a scan-result tag at all. A deny-Malicious gate lets all of those fall through silently. Prefer data-plane ABAC conditions over management-plane Azure Policy for this, and note that blob-index-tag conditions are still preview-gated on ADLS Gen2 / hierarchical-namespace accounts — validate before relying on tag-based ABAC there. - Route Defender alerts to your SOC incident queue, with the tag-read query baked into the playbook so analysts can confirm the scan result independently from the portal view.
Further reading
- Malware Scanning in Defender for Storage — overview
- Defender for Storage alerts reference
StorageBlobLogsschema- MITRE T1204 User Execution
- MITRE T1567 Exfiltration over Web Service
Scan-on-upload is the control that finally puts storage accounts on the same footing as email and endpoints. The part that makes it useful for a real SOC isn’t the detection — it’s the telemetry that lands in Log Analytics at the same time, so “malware was uploaded” can become “malware was uploaded and exfiltrated to this caller in the same Sentinel incident.”

Jerrad Dahlager, CISSP, CCSP
Cloud Security Architect · Adjunct Instructor
Marine Corps veteran and firm believer that the best security survives contact with reality.
Have thoughts on this post? I'd love to hear from you.