On this page
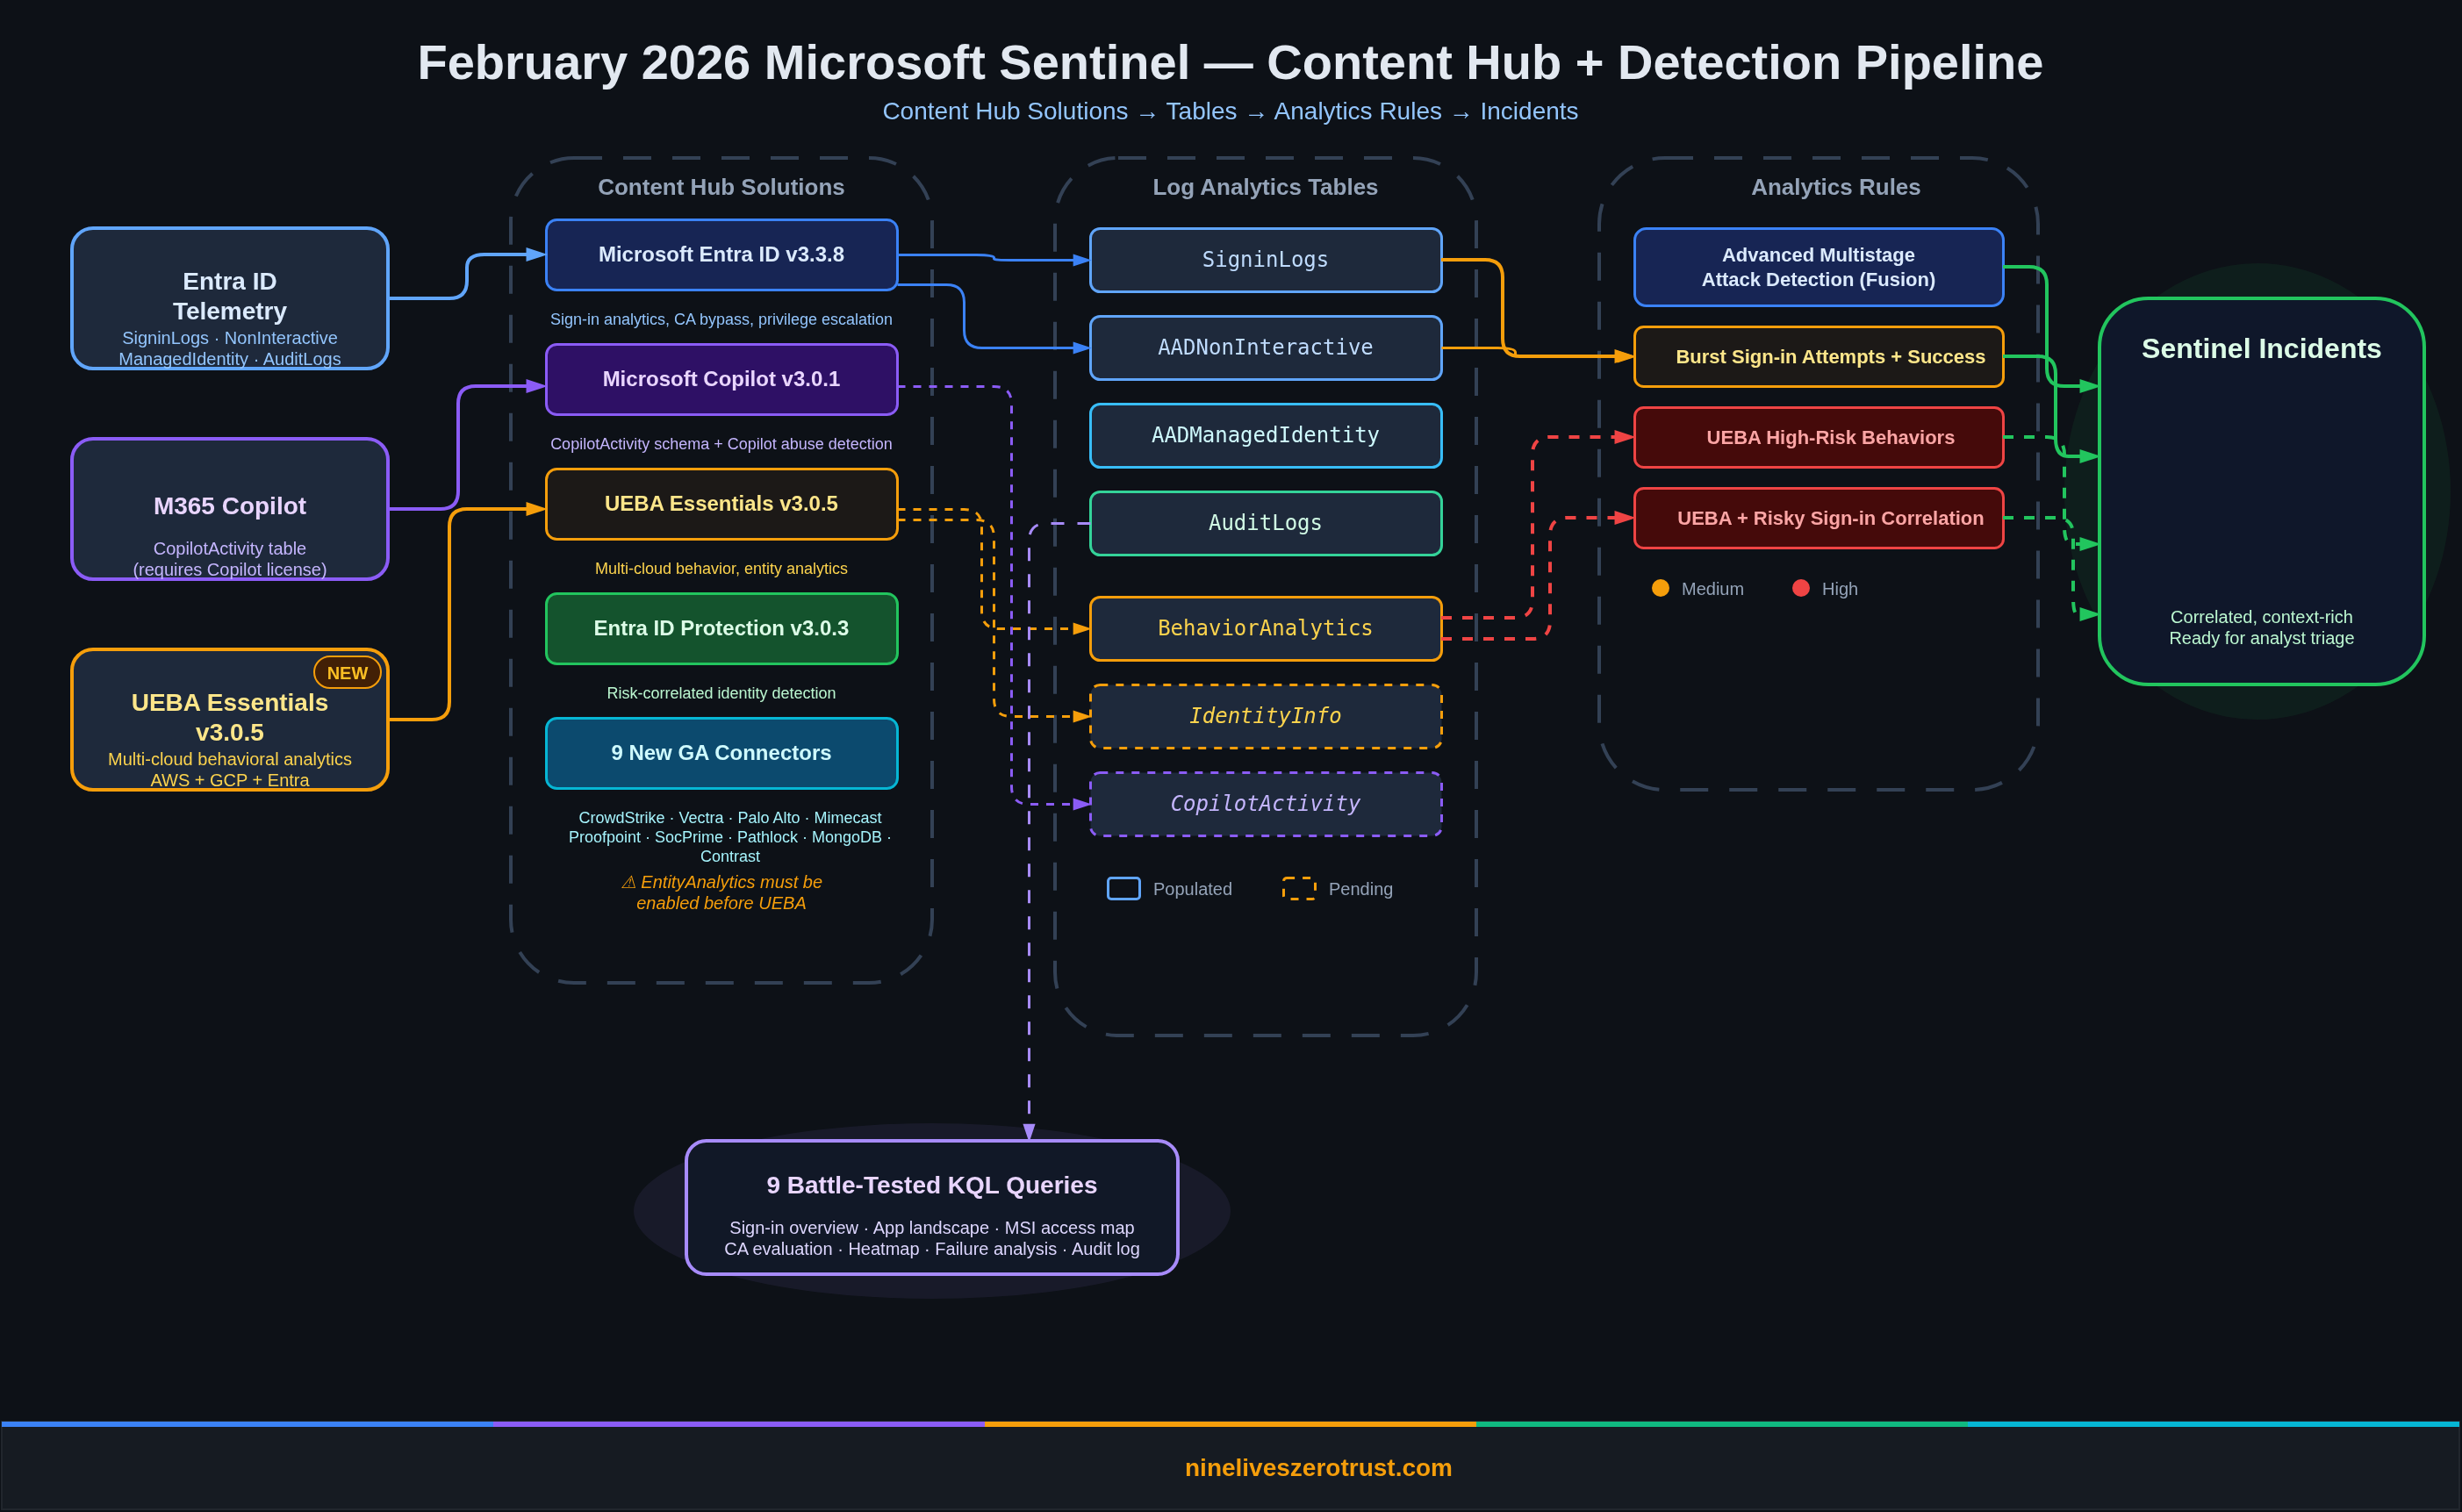
February 2026 brought one of the more substantial Sentinel drops in recent memory. UEBA Essentials hit v3.0.6 with a refined workbook and more than 30 hunting queries (including multi-cloud detections shipped in earlier releases), the M365 Copilot data connector landed in public preview, nine connectors graduated to GA, and the content hub now has four solutions worth deploying together.
I built everything in this post inside a live Sentinel sandbox, ran every query against real telemetry, and enabled the full UEBA pipeline end to end. The exploration queries all returned data at time of testing. The analytics rule queries use rolling time windows (ago(30m), ago(1h), ago(2h)) so they’ll only fire when fresh events match, which is exactly how scheduled rules are designed to work.
What Shipped in February 2026
| Update | Impact |
|---|---|
| UEBA Essentials 3.0.6 | Cleaned up PII-like sample values in workbook; workbook loading fix in 3.0.5; multi-cloud hunting queries (AWS, GCP, Okta) shipped in earlier 3.0.x releases |
| M365 Copilot Data Connector | CopilotActivity table for auditing Copilot interactions across the Microsoft 365 suite |
| 9 New GA Connectors | Including CrowdStrike Falcon, Vectra XDR, Palo Alto Cloud NGFW, Proofpoint POD, and more |
| Microsoft Entra ID 3.3.8 | Fixed broken links in an analytics rule; analytics rule and hunting query templates ship with the solution overall |
| Entra ID Protection 3.0.3 (July 2025) | Improved entity mappings and updated playbook configurations; included for its SecurityAlert correlation rule |
| Partner-Built Security Copilot Agents | Pre-built autonomous agents from BlueVoyant, AdaQuest, Glueckkanja |
| Enhanced Reports in Threat Intelligence Briefing Agent | Auto-generated threat briefs scoped to your environment’s actual attack surface |
| Multi-Tenant Content Distribution (Preview) | Replicate analytics rules, automation rules, workbooks, and built-in alert tuning rules across Sentinel tenants from the Defender portal |
| Codeless Connector Framework (Preview) | Microsoft-managed connector runtime replacing Azure Function polling; push-based delivery also now in preview; legacy HTTP Data Collector API retiring September 14, 2026 |
| Purview DSI Integration (GA, January 2026) | AI-powered deep content analysis from Purview combined with Sentinel graph analytics for data security investigations |
| Azure Portal Retirement Extended | Sentinel management in the Azure portal now sunsets March 31, 2027; Defender portal becomes the sole interface |
Lab Setup: Content Hub Installs
Before writing queries, you need the detection content. Here’s what I installed via the Content Hub and the order that matters.
1. Microsoft Entra ID (v3.3.8)
The foundation. The solution as a whole deploys analytics rule templates for sign-in anomalies, privileged role grants, service principal credential additions, and conditional access bypass attempts. The 3.3.8 update itself fixed a broken link in an analytics rule, but the solution is still the first thing to install because it provides the core Entra detection library.
2. Microsoft Copilot (v3.0.1)
Adds the CopilotActivity table schema and data connector. The solution does not include analytics rules or detection templates. It’s purely a data ingestion pipeline. The v3.0.1 update shipped with the CopilotActivity table schema. The table won’t populate until you connect the M365 Copilot data connector and have active Copilot licenses generating audit events. More on that below.
3. UEBA Essentials (v3.0.6)
This solution ships more than 30 hunting queries, including multi-cloud detections for AWS CloudTrail, GCP IAM, and Okta, plus the UEBA Behaviors Analysis Workbook. Multi-cloud hunting queries were introduced in v3.0.2 (November 2025) and expanded in v3.0.3. The v3.0.4 release added the workbook, v3.0.5 fixed a workbook loading issue, and v3.0.6 (February 10, 2026) cleaned up PII-like sample values in the workbook. Install this for the full set of behavioral hunting content regardless of version history.
Critical dependency: UEBA requires EntityAnalytics to be enabled first. If you try to enable UEBA without it, you’ll get:
Enabling 'Ueba' requires 'EntityAnalytics' to be enabled
Enable EntityAnalytics with Microsoft Entra ID as the entity provider (the Sentinel API parameter still uses AzureActiveDirectory), then enable UEBA with your data sources (AuditLogs, AzureActivity, SecurityEvent, SigninLogs).
4. Entra ID Protection (v3.0.3)
Deploys an analytics rule that correlates two SecurityAlert types (“Unfamiliar sign-in properties” and “Atypical travel”), joining them with IdentityInfo within a 10-minute window. This is SecurityAlert-to-SecurityAlert correlation, not a SigninLogs query. The v3.0.3 release (July 2025) improved entity mappings and updated playbook configurations. Requires Entra ID P2.
Battle-Tested KQL: Queries That Returned Real Data
Every query below ran successfully against a live Sentinel workspace. I’m including the actual results so you know what to expect.
Sign-in Activity Overview
The first thing to establish in any identity-focused Sentinel deployment: what does normal look like? This query joins interactive and non-interactive sign-in logs by hour to give you baseline traffic patterns.
let interactive = SigninLogs
    | summarize InteractiveCount=count() by bin(TimeGenerated, 1h);
let noninteractive = AADNonInteractiveUserSignInLogs
    | summarize NonInteractiveCount=count() by bin(TimeGenerated, 1h);
interactive
| join kind=fullouter noninteractive on TimeGenerated
| project
    TimeGenerated = coalesce(TimeGenerated, TimeGenerated1),
    InteractiveCount = coalesce(InteractiveCount, 0),
    NonInteractiveCount = coalesce(NonInteractiveCount, 0),
    TotalCount = coalesce(InteractiveCount, 0) + coalesce(NonInteractiveCount, 0)
| sort by TimeGenerated desc
What it shows: Interactive sign-ins (human at a browser) vs. non-interactive (token refreshes, background app auth). In most environments, non-interactive volume dwarfs interactive by 10-50x. If that ratio suddenly inverts, something changed.
Application Sign-in Landscape
Which apps are generating the most authentication traffic, and which ones are failing?
AADNonInteractiveUserSignInLogs
| summarize
    TotalSignIns=count(),
    SuccessCount=countif(ResultType == '0'),
    FailureCount=countif(ResultType != '0'),
    UniqueUsers=dcount(UserPrincipalName)
    by AppDisplayName
| extend FailureRate=round(todouble(FailureCount) / todouble(TotalSignIns) * 100, 2)
| sort by TotalSignIns desc
| take 15
Lab results: Microsoft Office 365 Portal led with 184 sign-ins across 1 user. Microsoft Edge and Azure CLI showed up with varying failure rates. An app with a consistently high failure rate (>20%) and no success usually means a misconfigured redirect URI or a disabled service principal — my lab surfaced both root causes.
Non-Interactive Sign-in Failure Analysis
This query surfaces the why behind failed non-interactive auth. It groups by ResultDescription instead of error code, which gives you actionable text instead of opaque numbers.
AADNonInteractiveUserSignInLogs
| where ResultType != "0"
| summarize
    FailureCount=count(),
    UniqueUsers=dcount(UserPrincipalName),
    ErrorCodes=make_set(ResultType),
    Apps=make_set(AppDisplayName)
    by ResultDescription
| sort by FailureCount desc
| take 10
Lab results, three distinct failure patterns:
| Error Code | Count | App | Root Cause |
|---|---|---|---|
50011 | 4 | Microsoft Edge | Mismatched redirect URI |
500014 | 3 | M365 Portal | Disabled service principal (lapsed subscription) |
50132 | 1 | Azure CLI | Expired session due to password change or expiration |
Error 500014 is the one to watch. A disabled service principal for the M365 Portal means a subscription lapsed or an admin deliberately disabled the app. Either way, it’s worth an incident.
Managed Identity and Service Principal Activity
Non-human identities are the fastest-growing attack surface in cloud environments. This query maps which managed identities are active, what they’re accessing, and how long they’ve been doing it.
AADManagedIdentitySignInLogs
| summarize
    SignInCount=count(),
    UniqueResources=dcount(ResourceDisplayName),
    FirstSeen=min(TimeGenerated),
    LastSeen=max(TimeGenerated)
    by ServicePrincipalName
| extend ActiveDays=datetime_diff('day', LastSeen, FirstSeen)
| sort by SignInCount desc
Lab results: A single managed identity (msg-resources-ce06) was accessing two resources: Azure Purview and Azure Resource Manager. It logged 10 sign-ins over two days.
For deeper context, drill into the resource-level access map:
AADManagedIdentitySignInLogs
| extend Location = tostring(LocationDetails.countryOrRegion)
| summarize
    AccessCount=count(),
    LastAccess=max(TimeGenerated)
    by ServicePrincipalName, ResourceDisplayName, IPAddress, Location
| sort by AccessCount desc
Why this matters: If a managed identity that normally accesses only ARM suddenly starts hitting Key Vault or Microsoft Graph, that’s a lateral movement signal. The baseline query above gives you the “normal” to compare against.
Conditional Access Policy Evaluation
How are your CA policies actually performing? This query expands the ConditionalAccessPolicies array from each sign-in and counts evaluations, successes, failures, and not-applied results per policy.
SigninLogs
| mv-expand CAPolicy=ConditionalAccessPolicies
| summarize
    Evaluations=count(),
    SuccessCount=countif(tostring(CAPolicy.result) == "success"),
    FailureCount=countif(tostring(CAPolicy.result) == "failure"),
    NotApplied=countif(tostring(CAPolicy.result) == "notApplied")
    by PolicyName=tostring(CAPolicy.displayName)
| where PolicyName != ""
| sort by Evaluations desc
Lab results, 9 policies evaluated:
| Policy | Evaluations | Success | Not Applied |
|---|---|---|---|
| Policy 1A - Block Desktop/Mobile Access | 8 | 0 | 0 |
| Policy 1B - Require MFA for Browser | 8 | 0 | 0 |
| Policy 2 - Require Authenticator MFA - Guest SharePoint | 8 | 0 | 0 |
| Policy 3 - Limited Access for Guest Users - SharePoint/OneDrive | 8 | 0 | 0 |
| Require multifactor authentication for admins | 8 | 0 | 8 |
| Block legacy authentication | 8 | 0 | 8 |
| Require multifactor authentication for all users | 8 | 0 | 8 |
| Require multifactor authentication for Azure management | 8 | 0 | 8 |
| Microsoft-managed: Multifactor authentication and reauthentication for risky sign-ins | 8 | 0 | 8 |
The custom policies (1A, 1B, 2, 3) are disabled — they return notEnabled in the sign-in logs, meaning Entra evaluates them but does not enforce the grant/session controls (the query above doesn’t count notEnabled as a separate column, so these appear as 0 across Success/Not Applied). The Microsoft-managed policies (MFA for admins, block legacy auth, MFA for all users, MFA for Azure management) are showing “not applied” because the sign-in conditions didn’t match their scope. This is exactly the kind of CA hygiene check you should run monthly.
Authentication Heatmap
Where are sign-ins clustering by hour and day of week? This establishes the temporal baseline that makes anomaly detection meaningful.
AADNonInteractiveUserSignInLogs
| extend Hour=datetime_part("hour", TimeGenerated),
         DayOfWeek=dayofweek(TimeGenerated)
| summarize SignIns=count() by Hour, DayOfWeek
| extend DayName=case(
    DayOfWeek == 0d, "Sunday",
    DayOfWeek == 1d, "Monday",
    DayOfWeek == 2d, "Tuesday",
    DayOfWeek == 3d, "Wednesday",
    DayOfWeek == 4d, "Thursday",
    DayOfWeek == 5d, "Friday",
    "Saturday")
| project DayName, DayOfWeek, Hour, SignIns
| sort by DayOfWeek asc, Hour asc
| project-away DayOfWeek
Lab results: Tuesday 18:00 UTC spiked at 235 sign-ins, which is when I was actively authenticating against the tenant. Wednesday showed a steady background hum of 1-18 sign-ins per hour across all 24 hours. In a production environment, render this as a heatmap visualization to spot off-hours authentication that shouldn’t exist.
Audit Log Activity Breakdown
What directory changes are happening and who’s making them?
AuditLogs
| summarize
    EventCount=count(),
    UniqueActors=dcount(coalesce(tostring(InitiatedBy.user.userPrincipalName), tostring(InitiatedBy.app.displayName))),
    UniqueTargets=dcount(tostring(TargetResources[0].displayName))
    by Category, OperationName
| sort by EventCount desc
Lab results:
| Category | Operation | Count |
|---|---|---|
| UserManagement | Update user | 5 |
| UserManagement | Change user license | 5 |
| RoleManagement | Remove permanent direct role assignment | 2 |
| ApplicationManagement | Add service principal | 1 |
| GroupManagement | Settings_GetSettingsAsync | 1 |
| GroupManagement | GroupLifecyclePolicies_Get | 1 |
| RoleManagement | Remove permanent eligible role assignment | 1 |
The Add service principal event at the bottom? That was the Defender for Cloud Apps - Microsoft Copilot Collector service principal being created when I installed the Copilot content hub solution. Every content hub install leaves an audit trail.
Service Principal and App Registration Changes
A focused view on non-human identity lifecycle events: the operations that matter most for tracking credential sprawl.
AuditLogs
| where Category == "ApplicationManagement" or Category == "Policy"
| project
    TimeGenerated,
    OperationName,
    Result,
    Actor=coalesce(tostring(InitiatedBy.user.userPrincipalName), tostring(InitiatedBy.app.displayName)),
    TargetName=tostring(TargetResources[0].displayName),
    TargetType=tostring(TargetResources[0].type)
| sort by TimeGenerated desc
Lab result: One event: the Copilot Collector service principal addition at 2026-02-11T02:51:59Z. In production, this query surfaces app registration credential rotations, new service principal creations, and permission grants that should trigger review workflows.
Analytics Rules: What’s Already Running
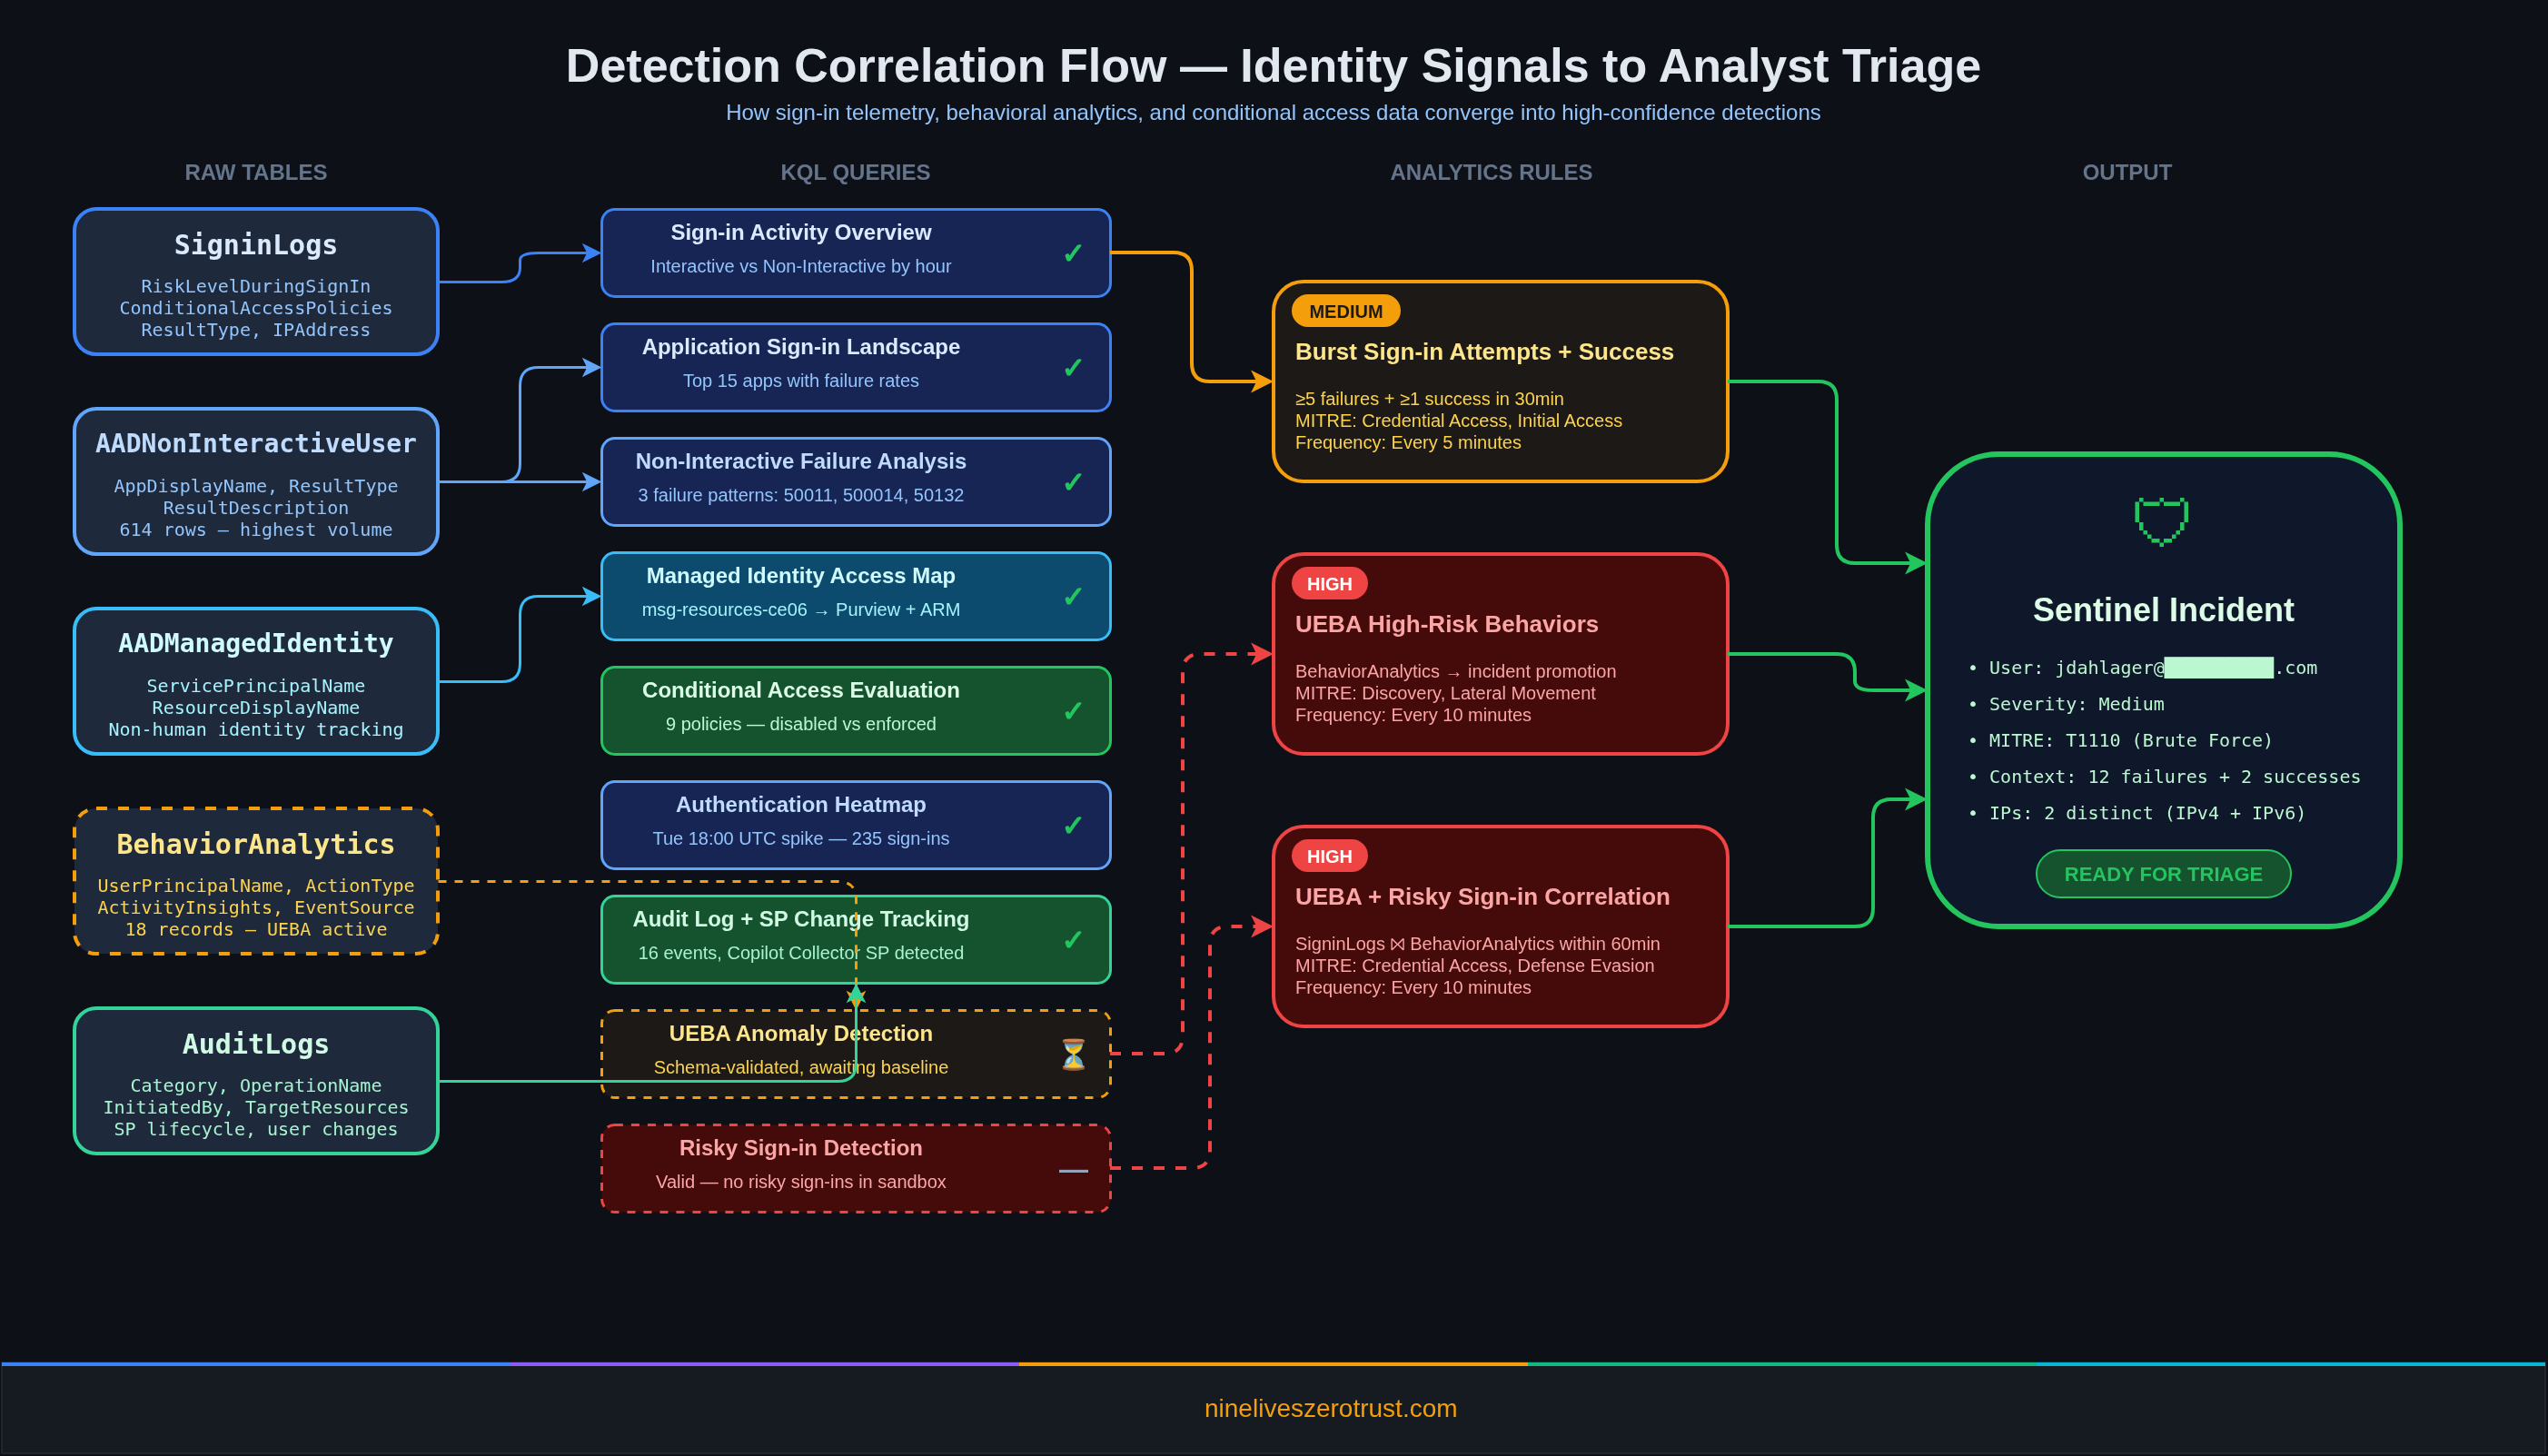
The content hub solutions deploy analytics rule templates, but they don’t auto-activate. Here are three custom rules I built and enabled in the lab that demonstrate how to turn the KQL above into scheduled detections.
LAB - Burst Sign-in Attempts with Success
Severity: High | MITRE: Credential Access (T1110), Initial Access (T1078.004) | Frequency: Every 5 minutes
SigninLogs
| where TimeGenerated > ago(30m)
| summarize
    FailedAttempts=countif(ResultType != '0'),
    SuccessAttempts=countif(ResultType == '0'),
    DistinctIPs=dcount(IPAddress)
    by UserPrincipalName
| where FailedAttempts >= 5 and SuccessAttempts > 0
Classic brute-force detection, but the SuccessAttempts > 0 filter is the key. A user who fails 20 times and never succeeds is probably just locked out. A user who fails 12 times and then succeeds from a different IP? That’s a compromised credential.
This rule fired in the lab. Sentinel created Incident #34 after detecting 12 failed sign-in attempts (error 50126, invalid username or password) followed by 2 successful authentications from 2 distinct IPs within a 30-minute window. MITRE tactics: Initial Access, Credential Access. Exactly the pattern you’d see in a real password spray that lands a valid credential.
LAB - UEBA High-Risk Behaviors
Severity: High | MITRE: Initial Access, Credential Access, Persistence, Discovery, Lateral Movement | Frequency: Every 10 minutes
BehaviorAnalytics
| where TimeGenerated > ago(1h)
| where isnotempty(UserPrincipalName)
| summarize
    BehaviorCount=count(),
    Actions=make_set(ActionType, 20),
    ActivityTypes=make_set(ActivityType, 10)
    by UserPrincipalName, SourceSystem
This promotes UEBA behavioral records into analyst-facing incidents. The BehaviorAnalytics table is where UEBA writes its enriched output. Each record includes ActivityInsights with contextual flags like FirstTimeConnectionFromCountryObservedInTenant and FirstTimeResourceAccessedInTenant. This rule ensures nothing sits in the table without generating an incident for triage. Note: the MITRE tactics listed above are deliberately broad because BehaviorAnalytics captures anomalies across the entire kill chain — from Initial Access to Lateral Movement. In production, use alertDetailsOverride with alertTacticsColumnName to dynamically assign the tactic from each behavior record rather than relying on static mappings.
This rule fired in the lab. After the brute-force simulation, UEBA produced 18 behavioral records in BehaviorAnalytics with enrichments including first-time country connections, first-time browser observations, and first-time app usage, all correlated against the same user within the same activity window.
LAB - UEBA and Risky Sign-in Correlation
Severity: High | MITRE: Initial Access (T1078.004), Credential Access (T1110), Defense Evasion (T1078) | Frequency: Every 10 minutes
let riskySignins = SigninLogs
    | where TimeGenerated > ago(2h)
    | where RiskLevelDuringSignIn !in ('none','low','')
    | project UserPrincipalName, SignInTime=TimeGenerated,
             RiskLevelDuringSignIn, IPAddress;
let suspiciousBehaviors = BehaviorAnalytics
    | where TimeGenerated > ago(2h)
    | where isnotempty(UserPrincipalName)
    | project UserPrincipalName, BehaviorTime=TimeGenerated,
             ActionType, ActivityInsights;
riskySignins
| join kind=inner suspiciousBehaviors
    on UserPrincipalName
| where abs(datetime_diff('minute', SignInTime, BehaviorTime)) <= 60
| summarize
    SignInEvents=dcount(SignInTime),
    BehaviorEvents=dcount(BehaviorTime),
    Actions=make_set(ActionType, 20)
    by UserPrincipalName, RiskLevelDuringSignIn
This is where detection engineering gets interesting. A risky sign-in alone? Could be a VPN hop or a travel day. A UEBA behavioral anomaly alone? Could be a new project or role change. Both within an hour of each other for the same user? That’s an investigation.
Why Correlation Beats Rule Sprawl
The standard approach is to build standalone rules: one for brute force, one for impossible travel, one for risky sign-ins, one for UEBA anomalies. Each fires independently. Each produces its own alert. The analyst opens four alerts for the same user, pieces together the context manually, and creates one incident.
Correlation inverts this. Instead of alerting on individual signals and expecting the analyst to assemble the picture, you build the picture in KQL and alert on the assembled result.
- Three standalone rules for a user who brute-forced a sign-in, triggered a UEBA behavioral anomaly, and had a risky sign-in event = three separate alerts. Analyst spends 10-15 minutes correlating them manually.
- One correlation rule that joins the same data = one alert with sign-in count, behavior count, ATT&CK techniques, source IPs, and apps in a single row. Analyst triages in 2-3 minutes.
The same join pattern works across other table pairs: DeviceEvents + BehaviorAnalytics for endpoint-to-behavior correlation, EmailEvents + SigninLogs for phishing-to-compromise chains, CloudAppEvents + IdentityInfo for SaaS activity correlated with entity-level risk. Treat correlation as the default detection architecture, not an optimization you add later.
Table Status
IdentityInfo Table: Populated
The IdentityInfo table populates through the EntityAnalytics engine. After enabling EntityAnalytics with Microsoft Entra ID as the entity provider (the Sentinel API parameter still references AzureActiveDirectory), the table synced 40 identity records within 24 hours. The schema includes columns for department, title, risk level, assigned roles, and group memberships, though not all fields populate in every tenant — in this sandbox, department and risk level were largely empty while roles and group memberships were present. This is the table that UEBA will join against once it completes its baseline learning period.
BehaviorAnalytics Table: Populated (18 Records)
UEBA started generating behavioral records within hours of being enabled. The BehaviorAnalytics table populated with 18 enriched records from the brute-force simulation, each annotated with ActivityInsights that include first-time flags like FirstTimeConnectionFromCountryObservedInTenant, FirstTimeBrowserObservedInTenant, and FirstTimeAppObservedInTenant. The UEBA engine dynamically compiles baselines from historical data in the connected tables, so first-time activity enrichments can appear within hours. Full peer-group behavioral baselines take approximately one week to mature.
Note: the UEBA behaviors layer tables (SentinelBehaviorInfo and SentinelBehaviorEntities) remain empty in this lab. That feature requires additional configuration and a longer processing window.
CopilotActivity Table: Schema Present, 0 Rows
The CopilotActivity table schema exists in the workspace after installing the Microsoft Copilot content hub solution, but it contains 0 rows. To populate it, you need:
- The M365 Copilot data connector configured and connected
- Active Microsoft 365 Copilot licenses generating audit events
The schema is ready. Once the data connector is wired up and Copilot licenses are active, the table will begin ingesting Copilot audit operations such as CopilotInteraction, plugin and promptbook lifecycle events (CreateCopilotPlugin, UpdateCopilotPromptBook), and scheduled prompt events (Microsoft365CopilotScheduledPrompt). Microsoft currently documents at least 20 Microsoft 365 Copilot operation names, with additional operations listed for Security Copilot workloads.
The 9 New GA Connectors
February brought nine connectors from preview to general availability:
- Mimecast Audit Logs: Email security platform administration telemetry
- CrowdStrike Falcon Endpoint Protection: EDR alerts and detection events
- Vectra XDR: Network and identity threat detection signals
- Palo Alto Networks Cloud NGFW: Cloud-native firewall logs
- SocPrime: Community-driven detection content and threat intelligence
- Proofpoint on Demand (POD) Email Security: Email threat detection events
- Pathlock: Application access governance and SoD violation logs
- MongoDB: Database audit and access logs
- Contrast ADR: Application detection and response telemetry
The CrowdStrike Falcon and Vectra XDR connectors stand out. CrowdStrike gives you endpoint detection signals that correlate directly with identity-based attacks. A compromised credential followed by suspicious process execution becomes a single investigation thread. Vectra adds network-layer detection that fills the gap between identity logs and endpoint telemetry.
Platform Changes Worth Knowing
February also shipped three platform-level changes that don’t affect detection content directly but will hit your operational planning:
Multi-tenant content distribution expanded its public preview. If you manage Sentinel across multiple tenants (MSSPs, this is you), you can now replicate analytics rules, automation rules, workbooks, and built-in alert tuning rules from the Defender portal without touching each workspace individually. Current preview caveats: automation rules that trigger playbooks aren’t supported yet, and alert tuning distribution is currently limited to built-in rules.
The Codeless Connector Framework (CCF) continues its rollout, replacing Azure Function-based polling connectors with a fully SaaS-managed runtime that includes built-in health monitoring and centralized credential management. Separately, CCF push-based delivery entered public preview for sources that can push events directly to Sentinel in real time. More importantly: the legacy HTTP Data Collector API is retiring on September 14, 2026. If you have custom ingestion pipelines using that API, start planning the migration to the Logs Ingestion API now.
The Azure portal sunset for Sentinel was extended to March 31, 2027. After that date, Sentinel will only be available in the Microsoft Defender portal. If your team still manages Sentinel from the Azure portal, you have roughly 14 months to transition workflows.
What to Do Next
- Install the four content hub solutions: Entra ID, Copilot, UEBA Essentials, Entra ID Protection
- Enable EntityAnalytics first, then UEBA. The dependency order matters.
- Run the sign-in overview and application landscape queries. Establish your baseline before enabling detection rules.
- Deploy the burst sign-in and UEBA correlation rules. Start with report-only mode, then flip to active after tuning.
- Wait for UEBA baselines. First-time activity enrichments appear within hours, but full peer-group behavioral baselines take about one week to mature. Microsoft recommends waiting for the full baseline period before relying on anomaly scores for automated response.
- Connect the Copilot data connector (if licensed). The
CopilotActivitytable is worth the effort.
Every query in this post was tested against a live Microsoft Sentinel workspace on February 11-12, 2026. If something doesn’t work in your environment, check the content hub solution version and make sure your data sources are actually flowing. A quick Usage | where DataType has "Signin" | summarize count() by DataType will tell you fast.
Resources
- What’s New in Microsoft Sentinel: February 2026 (Microsoft Tech Community)
- The Microsoft Copilot Data Connector for Microsoft Sentinel is Now in Public Preview (Microsoft Tech Community)
- UEBA Solution Power Boost: Practical Tools for Anomaly Detection (Microsoft Tech Community)
- Transitioning from the HTTP Data Collector API to the Log Ingestion API (Microsoft Tech Community)
- Migrate from the HTTP Data Collector API to the Log Ingestion API (Microsoft Learn)
- CCF Push Connectors Public Preview (Microsoft Tech Community)
- What’s New in Microsoft Sentinel (Microsoft Learn)
- UEBA Essentials Release Notes (GitHub - Azure/Azure-Sentinel)

Jerrad Dahlager, CISSP, CCSP
Cloud Security Architect · Adjunct Instructor
Marine Corps veteran and firm believer that the best security survives contact with reality.
Have thoughts on this post? I'd love to hear from you.