On this page
Getting custom data into Microsoft Sentinel has traditionally required a lot of moving parts. You need a Data Collection Endpoint, a Data Collection Rule, an Entra app registration with a client secret, RBAC role assignments, a custom table definition, and usually an Azure Function to glue it all together. That’s six manual steps before you even write your first KQL query.
Microsoft’s Codeless Connector Framework (CCF) Push mode, now in public preview, coordinates that runtime provisioning. You still author four connector artifacts, place them in an Azure-Sentinel solution, build and inspect the package, and deploy it. After that, one portal action provisions the DCE, DCR, custom table, Entra app registration, client secret, and Monitoring Metrics Publisher RBAC assignment.
This matters now because Microsoft says support for the deprecated legacy HTTP Data Collector API ends on September 14, 2026. If you’re still using POST https://<workspace-id>.ods.opinsights.azure.com/api/logs, start migrating.
Hands-on Lab: All four connector artifacts, owner-bound sandbox scripts, analytics-rule examples, and the Python sender are in the companion lab.
Deploy-Lab.ps1validates the artifacts and deploys infrastructure, five disabled rules, and the workbook; it does not claim that a raw connector definition is a complete solution. Package the artifacts with Microsoft’s current Azure-Sentinel tooling, inspect and deploy that generated package, and then use its Deploy Push Connector Resources portal action.
What is CCF Push?
The Codeless Connector Framework has two modes:
- Poll mode — Sentinel pulls data from an API on a schedule (good for SaaS APIs with rate limits)
- Push mode — Your application pushes data to a DCE endpoint via OAuth (good for real-time feeds, custom collectors, and migration from the legacy API)
Push mode is the focus of this post because it solves the hardest integration pattern: getting arbitrary external data into Sentinel without building Azure Functions or Logic Apps.
What Gets Auto-Provisioned
When you click “Deploy Push Connector Resources” in the Sentinel data connectors gallery, CCF Push creates:
| Resource | What it does |
|---|---|
| Data Collection Endpoint (DCE) | HTTPS endpoint that accepts your JSON payloads |
| Data Collection Rule (DCR) | Transforms and routes data to the custom table |
| Custom Log Analytics table | FeodoTracker_CL with your defined schema |
| Entra ID app registration | Service principal for OAuth authentication |
| Client secret | Credential for the app registration (shown once) |
| RBAC role assignment | Monitoring Metrics Publisher on the DCR |
Old Way vs CCF Push
| Step | Manual Setup | CCF Push |
|---|---|---|
| Create DCE | az monitor data-collection endpoint create | Auto |
| Define custom table | az monitor log-analytics workspace table create | Auto |
| Create DCR with transforms | az monitor data-collection rule create | Auto |
| Register Entra app + secret | Azure Portal → App Registrations | Auto |
| Assign RBAC | az role assignment create | Auto |
| Build sender application | Azure Function / Logic App | You write this |
| Provision runtime resources | Multiple coordinated commands | One portal action after solution authoring, packaging, review, and deployment |
CCF coordinates the runtime resources, but you still own the connector schema, four artifacts, solution package, sender, tests, credential handling, and operational review.
The Data Source: abuse.ch Feodotracker
Feodotracker is a free threat intelligence feed maintained by abuse.ch that tracks botnet command-and-control (C2) server infrastructure. Its covered-family roster changes over time, so the feed’s current malware labels are the source of truth rather than a hard-coded family list in this guide.
The feed provides:
- IP addresses of confirmed C2 servers
- Port numbers used for C2 communication
- Malware family attribution
- First seen / last seen timestamps
- Status (online, offline)
- Country of the hosting infrastructure
The Feodotracker JSON endpoint requires no authentication:
https://feodotracker.abuse.ch/downloads/ipblocklist.json
This is a live third-party indicator feed rather than a synthetic fixture. Its records can support correlation against network logs, but they remain external observations: validate freshness, context, licensing, and false positives before using them for blocking or incident decisions.
Lab Deployment
Prerequisites
- Azure subscription (free trial works)
- PowerShell 7.4+ with Azure CLI installed and authenticated
- Python 3.10+ with
pip - Permission to create the group plus Contributor and Microsoft Sentinel Contributor on the target scope
- Entra permission to create an application and client secret (typically Application Developer or higher)
- Owner or User Access Administrator, or equivalent exact permission to assign Monitoring Metrics Publisher on the DCR
- Access to the official Azure-Sentinel repository and current solution-packaging tooling
The bundled sender supports Azure public cloud endpoints only. Its identity audience and DCE hostname checks are not parameterized for sovereign Azure clouds; adapt and revalidate them before use outside public Azure.
Deploy
# Clone and pin the exact reviewed companion revision.
git clone https://github.com/j-dahl7/sentinel-ccf-push-connector.git
Set-Location sentinel-ccf-push-connector
git checkout d6fa1ff520119b72f5e85bd100c2106471782c0b

# First inspect the exact target; this performs no Azure or local-state writes.
./scripts/Deploy-Lab.ps1 -Location "eastus" -WhatIf

# Deploy with analytics rules disabled for review.
./scripts/Deploy-Lab.ps1 -Location "eastus"
Note: The script writes a private, ignored ownership manifest before its first Azure mutation and refuses an existing group or same-name content without exact provenance. It validates but does not install the connector artifacts. Follow Microsoft’s current CCF Push guide to package them as a complete solution, deploy the generated package to this workspace, and only then use the portal button. Review and tune every query before opting in with
-EnableSentinelRules.
What Gets Deployed
| Resource | Type | Purpose |
|---|---|---|
| Log Analytics workspace | Microsoft.OperationalInsights/workspaces | Data storage |
| Sentinel onboarding | Microsoft.SecurityInsights/onboardingStates | Enable Sentinel |
| Four CCF Push artifacts | Packaging input | Table, DCR, UI definition, and Push configuration |
| Packaged CCF Push connector | Data connector (Push kind) | Separately deployed solution whose portal action provisions DCE/DCR/table/app |
FeodoTracker_CL | Custom table | Provisioned by the packaged connector workflow |
| 5 analytics-rule examples | Scheduled KQL, disabled by default | Feed analysis + network TI correlation |
| 1 workbook | Sentinel workbook | Threat intel dashboard (5 panels) |
Cost Estimate
- Log Analytics and Sentinel charges vary by region, tier, retention, and current billing meters
- Feodotracker feed volume varies; inspect the current live response before estimating ingestion cost
- No Azure Function or Logic App is deployed by this lab; the sender still needs a machine or runner whose usage may be billable
- Total: typically low for this lab; confirm current regional ingestion pricing before budgeting
Building the CCF Push Connector
The connector consists of four JSON artifacts that define the table schema, data collection rule, connector UI, and push configuration. These files are inputs to Microsoft’s Azure-Sentinel solution-packaging process; deploying only the UI definition omits the context the portal workflow needs. Use the current official packaging guide and review its generated ARM template before deploying it to the owner-tagged lab workspace.
Step 1: Define the Custom Table Schema
The artifact blocks below are explanatory excerpts, not a complete deployable package. Use the full pinned connector/ files for destinations, IDs, permissions, and packaging context.
The table schema maps to the Feodotracker JSON fields. Every custom table in Log Analytics requires a TimeGenerated column of type datetime.
{
  "properties": {
    "schema": {
      "name": "FeodoTracker_CL",
      "columns": [
        { "name": "TimeGenerated", "type": "datetime", "description": "Ingestion timestamp" },
        { "name": "ip_address", "type": "string", "description": "C2 server IP address" },
        { "name": "port", "type": "int", "description": "C2 communication port" },
        { "name": "status", "type": "string", "description": "C2 server status (online/offline)" },
        { "name": "malware", "type": "string", "description": "Malware family name" },
        { "name": "first_seen", "type": "datetime", "description": "When the C2 was first observed" },
        { "name": "last_seen", "type": "datetime", "description": "When the C2 was last observed" },
        { "name": "country", "type": "string", "description": "Hosting country code" }
      ]
    }
  }
}
Step 2: Create the Data Collection Rule
The DCR defines the input stream schema and a transform KQL query. This connector sets TimeGenerated = now() for every incoming record, recording the ingestion transformation time. Publisher timestamps remain in first_seen and last_seen; this expression is not a conditional fallback for missing timestamps.
{
  "properties": {
    "dataCollectionEndpointId": "[auto-provisioned]",
    "streamDeclarations": {
      "Custom-FeodoTrackerStream": {
        "columns": [
          { "name": "ip_address", "type": "string" },
          { "name": "port", "type": "int" },
          { "name": "status", "type": "string" },
          { "name": "malware", "type": "string" },
          { "name": "first_seen", "type": "datetime" },
          { "name": "last_seen", "type": "datetime" },
          { "name": "country", "type": "string" }
        ]
      }
    },
    "dataFlows": [
      {
        "streams": ["Custom-FeodoTrackerStream"],
        "destinations": ["logAnalyticsWorkspace"],
        "transformKql": "source | extend TimeGenerated = now()",
        "outputStream": "Custom-FeodoTracker_CL"
      }
    ]
  }
}
The transformKql field is where you can enrich, filter, or reshape data before it lands in the table. For this lab, source | extend TimeGenerated = now() is all we need.
Step 3: Create the Connector Definition
The connector definition controls how the connector appears in the Sentinel Data Connectors gallery — the icon, description, instructions, and the deploy button.
{
  "kind": "Customizable",
  "properties": {
    "connectorUiConfig": {
      "id": "FeodotrackerCCFPush",
      "title": "Feodotracker Botnet C2 Feed (CCF Push)",
      "publisher": "Nine Lives, Zero Trust (Lab)",
      "descriptionMarkdown": "Ingests botnet C2 indicators from abuse.ch Feodotracker...",
      "graphQueriesTableName": "FeodoTracker_CL",
      "dataTypes": [
        {
          "name": "FeodoTracker_CL",
          "lastDataReceivedQuery": "FeodoTracker_CL | summarize max(TimeGenerated)"
        }
      ],
      "connectivityCriteria": [
        {
          "type": "IsConnectedQuery",
          "value": [
            "FeodoTracker_CL\n| summarize LastLogReceived = max(TimeGenerated)\n| project IsConnected = LastLogReceived > ago(7d)"
          ]
        }
      ],
      "permissions": {
        "resourceProvider": [
          {
            "provider": "Microsoft.OperationalInsights/workspaces",
            "permissionsDisplayText": "Read and Write permissions on the workspace",
            "requiredPermissions": { "write": true, "read": true, "delete": true }
          }
        ]
      },
      "instructionSteps": [
        {
          "title": "Deploy Push Connector Resources",
          "description": "Click the button below to auto-provision the DCE, DCR, custom table, and Entra app registration.",
          "instructions": [
            {
              "type": "DeployPushConnectorButton"
            }
          ]
        }
      ]
    }
  }
}
The "type": "DeployPushConnectorButton" instruction is what creates the deploy button. When clicked, Sentinel provisions all the resources listed above.
Step 4: Create the Push Data Connector
This ties the connector definition to the push configuration:
{
  "kind": "Push",
  "properties": {
    "connectorDefinitionName": "FeodotrackerCCFPush",
    "dcrConfig": {
      "streamName": "Custom-FeodoTrackerStream",
      "dataCollectionEndpoint": "[auto]",
      "dataCollectionRuleImmutableId": "[auto]"
    }
  }
}
Step 5: Deploy and Collect Credentials
After packaging the four artifacts with Microsoft’s current Azure-Sentinel tooling, inspecting the generated template, and deploying the complete package to the owned workspace, open the Sentinel Data Connectors gallery, find the “Feodotracker Botnet C2 Feed” connector, and click Deploy Push Connector Resources. Deploy-Lab.ps1 alone does not install that package.
Sentinel displays the connection credentials:
- Tenant ID — your Entra tenant
- Client ID — the auto-provisioned app registration
- Client Secret — shown once, copy it immediately
- DCE URI — the Data Collection Endpoint URL
- DCR Immutable ID — identifies the Data Collection Rule
- Stream Name —
Custom-FeodoTrackerStream
Save these — you’ll need them for the sender script.
The Sender Application
The Python script fetches C2 indicators from abuse.ch, transforms them to match the table schema, authenticates via OAuth 2.0 client credentials, and POSTs batches to the DCE.
Use the exact reviewed sender source from the pinned companion checkout. Keeping validation, bounds and retries together avoids turning an abbreviated example into an unbounded credential-bearing client.
python3 -m pip install --require-hashes -r ./scripts/requirements.lock
python3 -m unittest discover -s ./tests -v
python3 ./scripts/Send-ThreatIntel.py
Before requesting an OAuth token, the sender validates the Azure ingestion destination, finishes the fixed provider download, and validates the whole transformed feed. It refuses redirects and compression, caps the body at 4 MiB and the list at 20,000 indicators, and bounds consumed fields. The body budget is 60 seconds after headers arrive, with ten-second connect/read timeouts; an in-progress read can extend to its timeout. A rejected feed is never partially ingested merely because its first records looked valid.
The full script with batching logic, error handling, and environment variable support is in the reviewed scripts/Send-ThreatIntel.py.
Key implementation details:
- OAuth scope:
https://monitor.azure.com//.default(note the double slash — this is required) - Batch size: At most 100 records and 512 KiB of serialized JSON per POST; oversized batches fail before transmission.
- POST endpoint:
{dce_uri}/dataCollectionRules/{dcr_id}/streams/{stream_name}?api-version=2023-01-01 - Bounded 429 handling: Honor
Retry-After, retry up to the configured limit, and raise on a terminal 429 so automation cannot report a false success - Ingestion delay: Azure Monitor ingestion latency varies; measure the live tenant and do not treat a fixed delay as a success guarantee
- Scheduling: Run via cron, Azure Automation, or GitHub Actions for continuous ingestion
Sentinel Analytics Rules
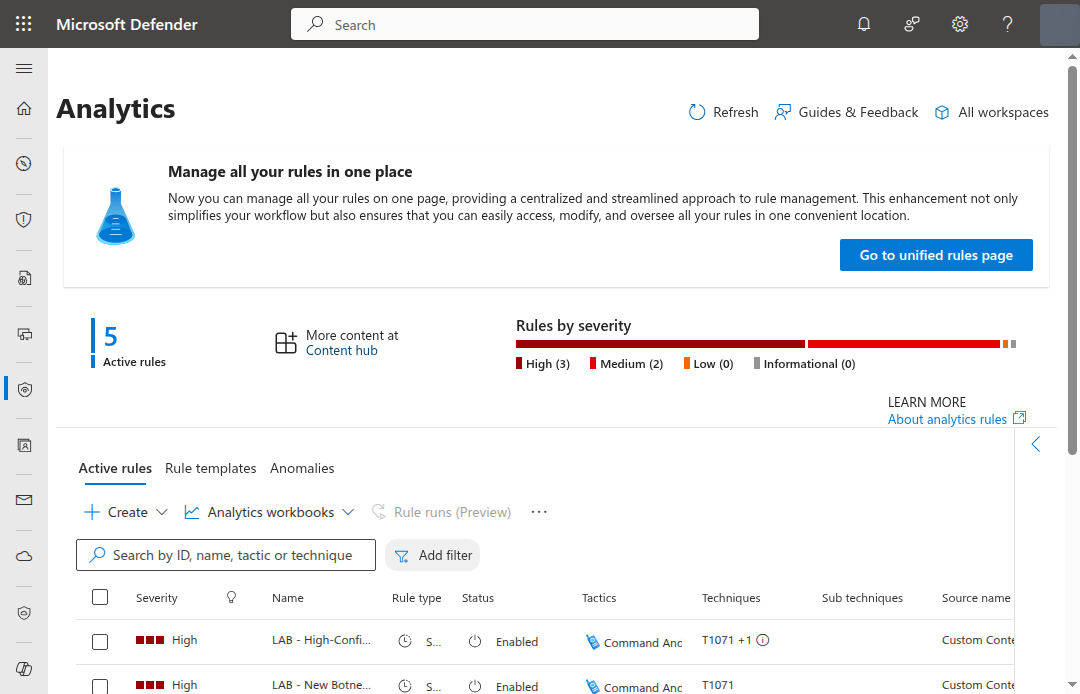
Five scheduled analytics-rule examples look for patterns in Feodotracker data. They are hypotheses to validate, not proof of compromise or production-ready detections. The first four analyze the feed itself. The fifth correlates indicators against supported network-log tables; it produces no useful result until at least one of those sources is populated and normalized as expected.
Rule 1: New Feed Malware Label Observed
When enabled, selects a malware-family label present in the last hour but absent from every observation in the preceding 14-day lookback represented in this table. Retaining every prior label prevents an IP’s later relabeling from erasing its earlier family from the baseline.
let KnownFamilies = FeodoTracker_CL
    | where TimeGenerated > ago(14d) and TimeGenerated < ago(1h)
    | where isnotempty(malware)
    | distinct malware;
FeodoTracker_CL
| where TimeGenerated > ago(1h)
| summarize arg_max(TimeGenerated, *) by ip_address
| where malware !in (KnownFamilies)
| summarize
    IndicatorCount = dcount(ip_address),
    FirstIP = min(ip_address),
    Countries = make_set(country, 10)
    by malware
| project
    TimeGenerated = now(),
    malware,
    IndicatorCount,
    FirstIP,
    Countries
Interpretation limit: This means the label is new to this workspace’s retained feed history. It does not by itself prove a new campaign, a new family, or newly active infrastructure; ingestion gaps and naming changes can produce the same result.
Rule 2: Feed Indicator Count Increase
When enabled, compares distinct online C2 IPs in the latest 24-hour window with the preceding 24-hour window and selects increases greater than 50%.
let Current = FeodoTracker_CL
    | where TimeGenerated > ago(1d)
    | where status == "online"
    | summarize CurrentCount = dcount(ip_address)
    | extend _key = 1;
let Previous = FeodoTracker_CL
    | where TimeGenerated between (ago(2d) .. ago(1d))
    | where status == "online"
    | summarize PreviousCount = dcount(ip_address)
    | extend _key = 1;
Current | join kind=inner (Previous) on _key
| where PreviousCount > 0
| extend ChangePercent = round(100.0 * (CurrentCount - PreviousCount) / PreviousCount, 1)
| where ChangePercent > 50
| project TimeGenerated = now(), CurrentCount,
    PreviousCount, ChangePercent
Why this matters: A sudden spike in active C2 infrastructure often precedes a large-scale spam or malware campaign. Operators spin up servers before launching.
Rule 3: Recent Feed Indicators on 443 or 8443
Selects recently observed online indicators on ports 443 or 8443. Those ports are commonly associated with TLS but do not prove encryption or evasion.
FeodoTracker_CL
| where TimeGenerated > ago(1h)
| summarize arg_max(TimeGenerated, *) by ip_address
| where status == "online"
| where port in (443, 8443)
| where last_seen > ago(7d)
| project TimeGenerated, ip_address, port,
    malware, country, first_seen, last_seen
Why this matters: Port 443 or 8443 can help prioritize investigation, but a feed-and-port match is only a triage lead. Validate asset context, freshness, traffic direction, and corroborating telemetry before any blocking decision.
Rule 4: Feed Country Concentration
Selects countries associated with at least 10 distinct feed IPs in the last hour. This is a geographic aggregation for review, not attribution.
FeodoTracker_CL
| where TimeGenerated > ago(1h)
| summarize C2Count = dcount(ip_address),
    Families = make_set(malware, 10),
    Ports = make_set(port, 10),
    SampleIPs = make_set(ip_address, 5)
    by country
| where C2Count >= 10
| project TimeGenerated = now(), country, C2Count,
    Families, Ports, SampleIPs
Interpretation limit: Country-level concentration can reflect provider size, feed coverage, geolocation error, or shared infrastructure. Do not infer a bulletproof host or build geographic blocks from this result alone.
Rule 5: Network Traffic Match to Feed Indicator
This is the rule that turns your passive threat intelligence into active detection. It joins the Feodotracker C2 IP list against your actual network traffic logs — CommonSecurityLog (firewalls, proxies), DnsEvents (DNS resolutions), or any other log source with destination IPs.
let ActiveC2 = FeodoTracker_CL
    | where TimeGenerated > ago(7d)
    | where status == "online"
    | distinct ip_address, malware, port;
union isfuzzy=true
    (datatable(TimeGenerated:datetime, SourceIP:string,
        DestinationIP:string, LogSource:string,
        Details:string)[]),
    (CommonSecurityLog
        | where TimeGenerated > ago(1d)
        | where isnotempty(DestinationIP)
        | project TimeGenerated, SourceIP, DestinationIP,
            LogSource = DeviceProduct, Details = Activity),
    (DnsEvents
        | where TimeGenerated > ago(1d)
        | where isnotempty(IPAddresses)
        | mv-expand IPAddress = split(IPAddresses, ",")
        | project TimeGenerated, SourceIP = ClientIP,
            DestinationIP = tostring(IPAddress),
            LogSource = "DNS", Details = Name)
| join kind=inner ActiveC2
    on $left.DestinationIP == $right.ip_address
| project TimeGenerated, SourceIP, DestinationIP,
    malware, LogSource, Details
Interpretation limit: A join result means the destination-IP string in a supported log row matched a recent feed row. Verify NAT/proxy context, event direction, feed freshness, timestamp alignment, and the underlying session before treating it as device communication or compromise.
The union isfuzzy=true with an empty datatable fallback lets the example
tolerate an unavailable table at name-resolution time. It does not normalize
arbitrary schemas or prove that the remaining table’s columns mean what the
query assumes, which is why the rules remain disabled for review.
Extending the correlation: Candidate sources include the following, but their availability and schemas depend on enabled connectors. Project each one into the five canonical columns and test it separately before adding it:
AzureNetworkAnalytics_CLfor NSG flow logsAZFWNetworkRulefor Azure FirewallDeviceNetworkEventsfor Defender for EndpointSyslogwith parsed destination IPs for Linux hosts
ATT&CK Mapping Boundary
The hardened examples do not assign ATT&CK tactics or techniques. A feed label, country, port, volume change, or destination-IP match does not establish the behavior required for T1071, T1573, T1583, or T1102. Add a mapping only after your normalized telemetry captures the protocol and behavior needed to support that claim.
Hunting Queries
Five proactive hunting queries for threat intelligence analysis. Run these manually during investigations or scheduled hunts.
Hunt 1: Feed Indicators by Malware Label Over Time
FeodoTracker_CL
| where TimeGenerated > ago(30d)
| summarize C2Servers = dcount(ip_address)
    by malware, bin(TimeGenerated, 1d)
| render timechart
Track how each botnet’s infrastructure grows or shrinks over time. Useful for understanding campaign tempo.
Hunt 2: Online Feed Indicators by Country (Last 30 Days)
FeodoTracker_CL
| where TimeGenerated > ago(30d)
| where status == "online"
| summarize ActiveC2 = dcount(ip_address),
    Families = make_set(malware, 20)
    by country
| sort by ActiveC2 desc
| take 20
Identify which countries host the most active C2 infrastructure. Cross-reference with your organization’s geographic exposure.
Hunt 3: Feed IPs First Seen in Last 7 Days
FeodoTracker_CL
| where TimeGenerated > ago(7d)
| where first_seen > ago(7d)
| summarize arg_max(TimeGenerated, *) by ip_address
| project ip_address, port, malware, country,
    first_seen, last_seen, status
| sort by first_seen desc
This surfaces records the publisher marked as first seen recently. Treat them as review candidates; recency alone does not establish severity or justify blocking.
Hunt 4: Long-Lived Online Feed Indicators (Over 90 Days)
FeodoTracker_CL
| where TimeGenerated > ago(1d)
| where status == "online"
| extend DaysActive = datetime_diff('day', now(), first_seen)
| where DaysActive > 90
| summarize arg_max(TimeGenerated, *) by ip_address
| project ip_address, port, malware, country,
    first_seen, DaysActive
| sort by DaysActive desc
Indicators observed across a long interval can be useful review candidates, but duration alone does not establish bulletproof hosting, failed takedown, current malice, or suitability for blocking.
Hunt 5: Feed Ingestion Health Check
FeodoTracker_CL
| summarize
    RecordCount = count(),
    DistinctIPs = dcount(ip_address),
    Families = dcount(malware),
    Countries = dcount(country),
    OnlineCount = countif(status == "online"),
    OldestRecord = min(first_seen),
    NewestRecord = max(last_seen)
    by bin(TimeGenerated, 6h)
| extend OnlinePercent = round(
    100.0 * OnlineCount / RecordCount, 1)
| sort by TimeGenerated desc
Review observed ingestion volume and publisher timestamps. This query emits only bins containing records; it does not generate explicit empty bins or prove completeness. A missing expected interval can reflect a delayed or failed run, an empty provider response, or ingestion latency. Correlate it with the sender’s run history, response counts, and credential health before assigning a cause.
Workbook: Threat Intelligence Dashboard
The workbook provides five panels for ongoing threat intelligence monitoring.
Panel 1: Feed Indicator Timeline
Timechart showing indicator count by malware family over time. Spot campaigns ramping up or winding down.
FeodoTracker_CL
| where TimeGenerated {TimeRange}
| summarize Indicators = dcount(ip_address) by malware, bin(TimeGenerated, 1d)
| render timechart
Panel 2: Geographic Distribution
Bar chart of C2 server count by country. Identify hosting hotspots.
FeodoTracker_CL
| where TimeGenerated {TimeRange}
| where status == "online"
| summarize C2Servers = dcount(ip_address) by country
| sort by C2Servers desc
| take 15
| render barchart
Panel 3: Online Feed IPs by Malware Label
Table of publisher-labeled online feed IPs by malware label, with latest observation and country context; it is not independent proof that each host is currently active.
FeodoTracker_CL
| where TimeGenerated {TimeRange}
| where status == "online"
| summarize OnlineFeedIPs = dcount(ip_address),
    LatestFeedObservation = max(last_seen),
    Countries = make_set(country, 5)
    by malware
| sort by OnlineFeedIPs desc
Panel 4: Recent Indicators
Table of the latest C2 indicators with full metadata, sorted by ingestion time.
FeodoTracker_CL
| where TimeGenerated {TimeRange}
| sort by TimeGenerated desc
| project TimeGenerated, ip_address, port, malware,
    status, country, first_seen, last_seen
| take 50
Panel 5: Network Log Matches to Feed IPs (Triage Only)
Table of network-log IP matches to recent online feed indicators. Review direction, DNS semantics, timing, and asset context before treating a match as communication or compromise.
let FeedIPs = FeodoTracker_CL
| where TimeGenerated {TimeRange}
| where status == "online"
| distinct ip_address, malware;
union isfuzzy=true
    (datatable(TimeGenerated:datetime, SourceIP:string,
        DestinationIP:string, LogSource:string)[]),
    (CommonSecurityLog
        | where TimeGenerated {TimeRange}
        | where isnotempty(DestinationIP)
        | project TimeGenerated, SourceIP, DestinationIP,
            LogSource = DeviceProduct),
    (DnsEvents
        | where TimeGenerated {TimeRange}
        | where isnotempty(IPAddresses)
        | mv-expand IPAddress = split(IPAddresses, ",")
        | project TimeGenerated, SourceIP = ClientIP,
            DestinationIP = tostring(IPAddress),
            LogSource = "DNS")
| join kind=inner FeedIPs
    on $left.DestinationIP == $right.ip_address
| project TimeGenerated, SourceIP, DestinationIP,
    malware, LogSource
| sort by TimeGenerated desc
| take 50
Automated Scheduling with GitHub Actions
The reviewed companion source includes a GitHub Actions workflow that can run Send-ThreatIntel.py every six hours after tests pass. It avoids an Azure Function, but GitHub-hosted runner use is governed by the repository owner’s current allowance, billing, and spending controls. The workflow also requires five long-lived connector values as secrets; restrict repository administration and rotate the client secret.
name: Ingest Feodotracker C2 Indicators

on:
  pull_request:
    paths:
      - '.github/workflows/ingest.yml'
      - 'scripts/**'
      - 'tests/**'
  schedule:
    - cron: '0 */6 * * *'
  workflow_dispatch:
    inputs:
      perform_ingest:
        description: 'Push indicators after tests pass'
        required: true
        default: false
        type: boolean

permissions:
  contents: read

jobs:
  ingest:
    runs-on: ubuntu-24.04
    timeout-minutes: 10
    steps:
      - name: Check out repository
        uses: actions/checkout@3d3c42e5aac5ba805825da76410c181273ba90b1 # v7.0.1
        with:
          persist-credentials: false
      - name: Set up Python
        uses: actions/setup-python@5fda3b95a4ea91299a34e894583c3862153e4b97 # v7.0.0
        with:
          python-version: '3.12'
          cache: pip
          cache-dependency-path: scripts/requirements.lock
      - name: Install dependencies
        run: pip install --disable-pip-version-check --require-hashes -r scripts/requirements.lock
      - name: Run sender unit tests
        run: python -m unittest discover -s tests -v
      - name: Push indicators to Sentinel
        if: ${{ github.event_name == 'schedule' || inputs.perform_ingest }}
        env:
          CCF_TENANT_ID: ${{ secrets.CCF_TENANT_ID }}
          CCF_CLIENT_ID: ${{ secrets.CCF_CLIENT_ID }}
          CCF_CLIENT_SECRET: ${{ secrets.CCF_CLIENT_SECRET }}
          CCF_DCE_URI: ${{ secrets.CCF_DCE_URI }}
          CCF_DCR_ID: ${{ secrets.CCF_DCR_ID }}
        run: python scripts/Send-ThreatIntel.py
To set up:
- Fork or clone
j-dahl7/sentinel-ccf-push-connector - Go to Settings → Secrets and variables → Actions
- Add the 5 connection credentials from the CCF Push deploy step
- Enable the workflow only after reviewing the schedule and secret scope
Pull-request runs and default manual runs validate without ingesting. Scheduled
runs ingest every six hours; a manual run pushes only when perform_ingest is
explicitly enabled. At roughly one minute per run, the six-hour schedule uses
about 120 runner minutes in a 30-day month. Check the repository owner’s current
included Actions allowance and spending controls rather than assuming those
minutes are free.
The workflow deliberately runs the sender tests before ingestion. If retry handling regresses—for example, a final HTTP 429 stops raising—the credentials are never used to push data in that run.
Cleanup Semantics
# Preview only; no deletion occurs
./scripts/Deploy-Lab.ps1 -Destroy -WhatIf

# Requires the exact local manifest and owner tag, waits, then verifies absence
./scripts/Deploy-Lab.ps1 -Destroy
The live command refuses an ownership mismatch, waits for Azure to finish the exact resource-group deletion, verifies absence, and only then removes its local manifest. The portal-created Entra application/service principal and GitHub Actions secrets are separate cleanup items: identify their exact IDs, prove they are unused elsewhere, then remove them manually.
Extending to Other Feeds
The same CCF Push pattern works for many JSON-producing sources that can be mapped to a stable schema. abuse.ch maintains several other free feeds that map directly to the same architecture:
| Feed | URL | What It Tracks | Schema |
|---|---|---|---|
| Feodotracker (this lab) | feodotracker.abuse.ch | Botnet C2 server IPs | IP, port, malware, country |
| URLhaus | urlhaus.abuse.ch | Malware distribution URLs | URL, threat type, host, tags |
| ThreatFox | threatfox.abuse.ch | IOCs (IPs, domains, hashes) | IOC type, value, threat type, malware |
| MalwareBazaar | bazaar.abuse.ch | Malware samples | SHA256, filename, signature, tags |
For each feed, you would:
- Define a new custom table schema (e.g.,
URLhaus_CL) - Create a new DCR with the appropriate stream and transform
- Add a new connector definition to the Sentinel gallery
- Write a sender script (or extend
Send-ThreatIntel.pywith a--feedparameter)
The CCF Push connector definition and DCR templates in this lab can be adapted by changing the table name, column definitions, and transform KQL. The authentication and push mechanics are identical.
Old Way vs New Way
If you’ve built custom Sentinel connectors before, this comparison captures the shift:
| Aspect | Legacy (DCE/DCR Manual) | CCF Push |
|---|---|---|
| Resource provisioning | Multiple manually coordinated resources | One portal action after a complete solution has been packaged and deployed |
| Entra app management | Manual registration + secret rotation | Auto-provisioned, secret shown on deploy |
| RBAC configuration | Manual role assignment | Auto-assigned Monitoring Metrics Publisher |
| Sender compute | Often an Azure Function or Logic App | Runs wherever you schedule it; that platform may still incur usage charges |
| Connector UI in Sentinel | None (hidden plumbing) | Full gallery entry with status, last data received |
| Maintenance | Function runtime updates, secret rotation | Low; sender scheduling, monitoring, and secret rotation still remain |
| ARM/solution artifacts | Several directly managed resources | Four coordinated artifacts packaged as a Sentinel solution |
| Migration effort from legacy API | Update ingestion infrastructure, schema, authentication, and sender | Package the connector, validate DCR/schema transforms, then adapt and test the sender’s endpoint, authentication, batching, and errors |
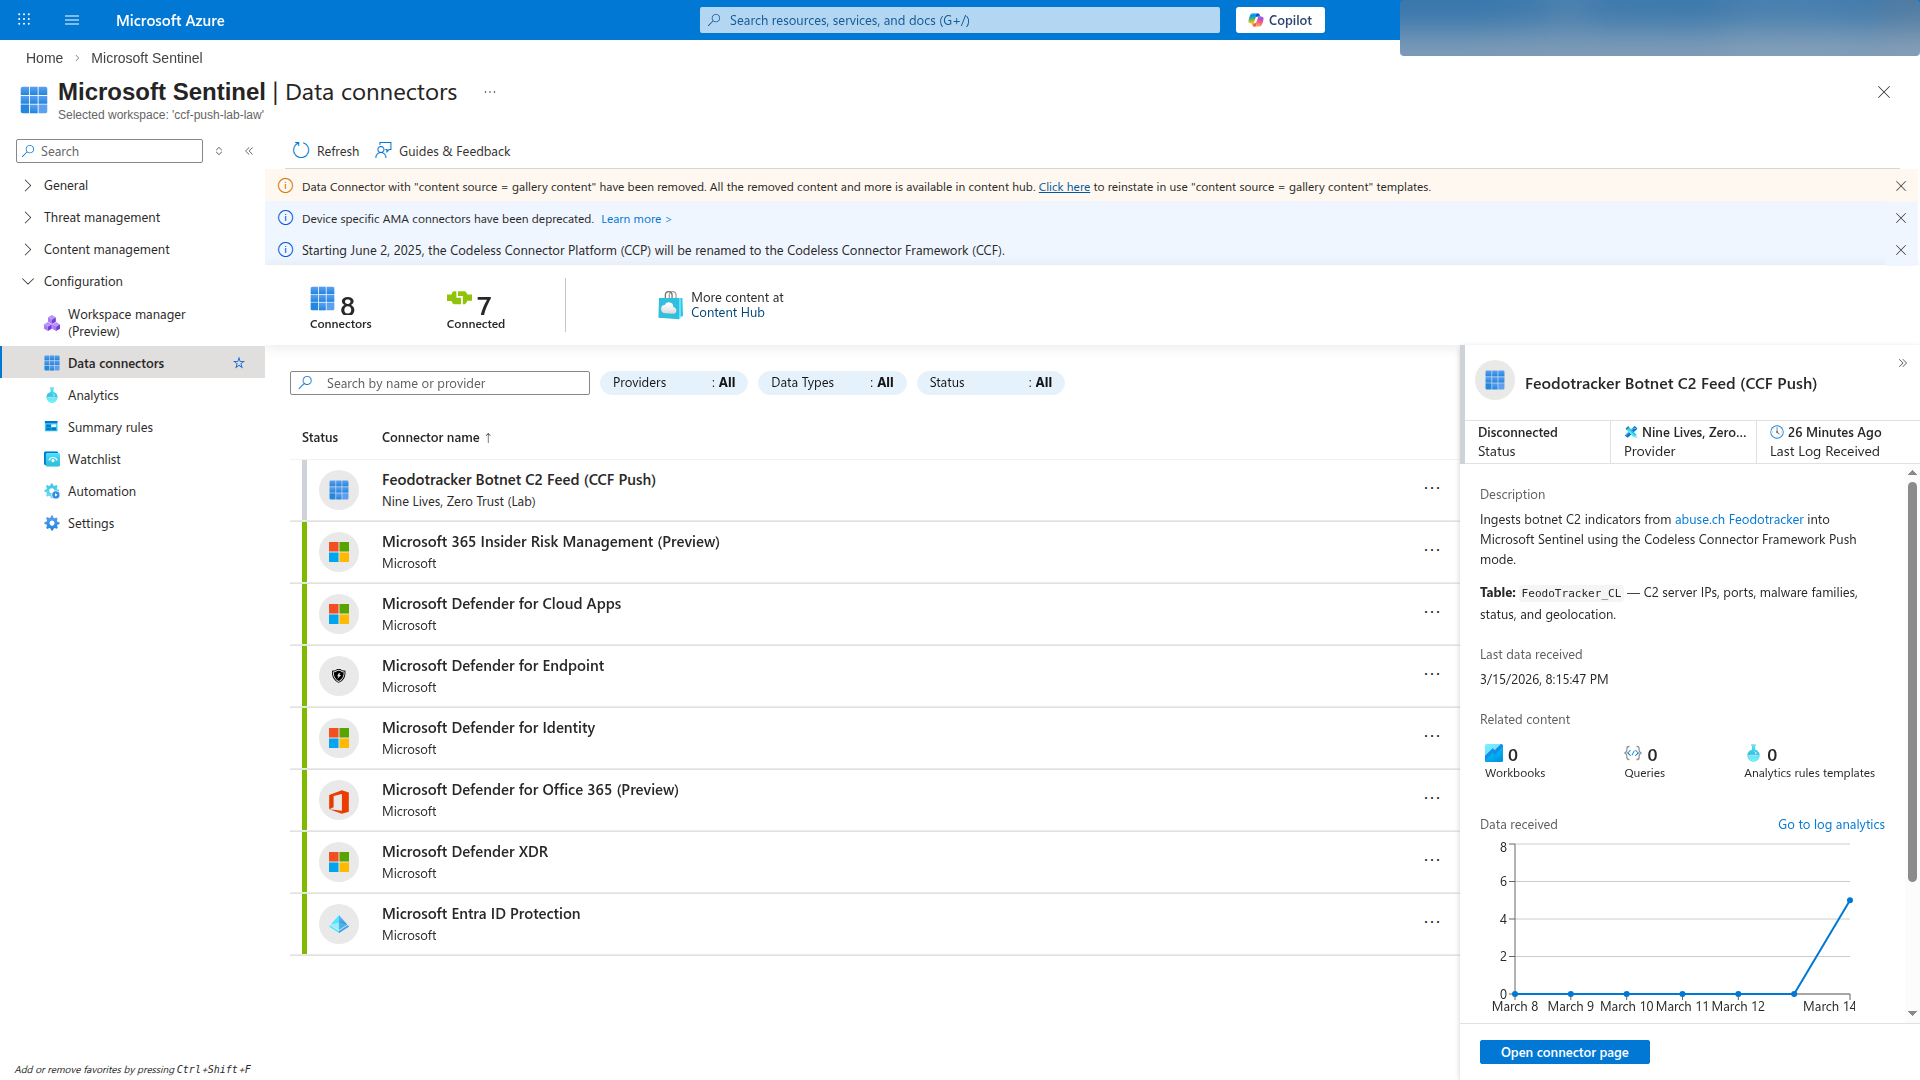
The biggest win isn’t the automation — it’s the visibility. Your custom connector shows up in the Sentinel Data Connectors gallery alongside Microsoft’s first-party connectors, with connection status, last data received timestamp, and a proper configuration UI.
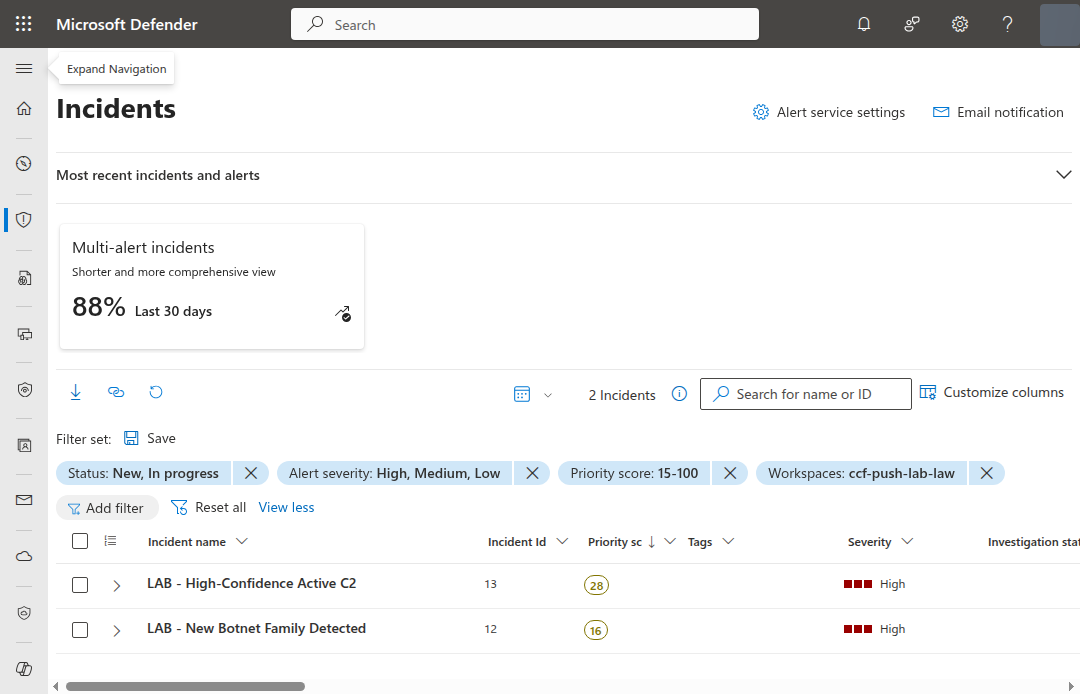
Key Takeaways
CCF Push eliminates the biggest friction point in getting custom data into Sentinel. No more manual DCE/DCR/app registration choreography.
Support for the deprecated legacy Data Collector API ends September 14, 2026. If you’re using the old
https://<workspace-id>.ods.opinsights.azure.com/api/logsendpoint, plan a migration to the supported Logs Ingestion API; CCF Push is one preview framework that uses that path.Push and poll serve different sources. Push gives the sender control over timing and batching; polling can be simpler when the source exposes a stable API and the platform should own collection.
Correlate TI with your network traffic. A threat intel feed is informational until you join it against your logs. Rule 5 turns passive indicators into active detections by matching C2 IPs against
CommonSecurityLog,DnsEvents, and any other network log source.abuse.ch publishes several no-cost community feeds. Feodotracker, URLhaus, MalwareBazaar, and ThreatFox can inform analysis, but each record still needs freshness, context, and false-positive review.
Scheduling is optional and billable-policy dependent. The companion workflow can ingest every six hours after tests pass; runner minutes, secrets exposure, and spending controls depend on the repository owner’s current GitHub plan and settings.
CCF Push uses coordinated solution artifacts. The definition, table, DCR, and Push configuration must be packaged together with Microsoft’s current tooling. The portal action then provisions the generated resources; raw JSON validation is not live deployment proof.
Resources
- Microsoft Learn: Create and package a CCF Push connector
- Microsoft Learn: Logs ingestion API overview
- abuse.ch Feodotracker
- Legacy Data Collector API deprecation
- Companion lab: j-dahl7/sentinel-ccf-push-connector

Jerrad Dahlager, CISSP, CCSP
Cloud Security Architect · Adjunct Instructor
Marine Corps veteran and firm believer that the best security survives contact with reality.
Have thoughts on this post? I'd love to hear from you.