On this page
After a compromised service principal incident, the first triage question is always the same: “What else can this identity reach?” The answer usually lives outside Sentinel, buried in entitlement exports, RBAC snapshots, or asset inventories that nobody wanted to pay analytics-tier ingestion costs to store.
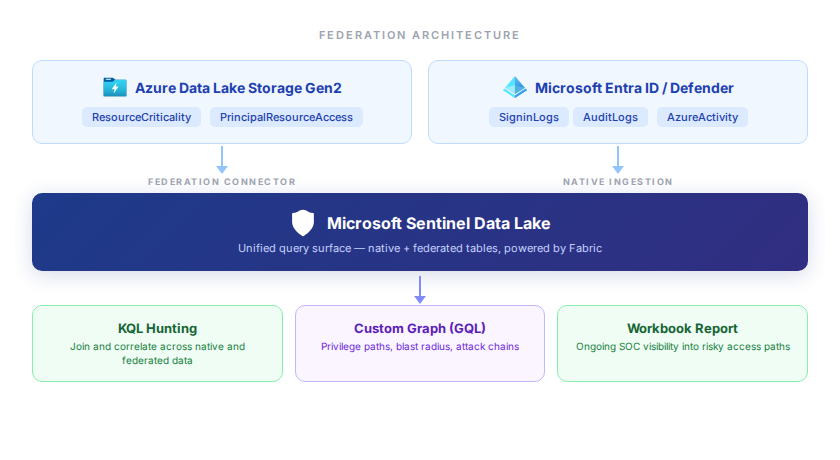
On April 1, 2026, Microsoft shipped two Sentinel features into public preview that change how this works: data federation and custom graphs. Instead of copying every access table into the analytics tier, you federate external context in place and query across it.
The question I wanted to answer:
Can a low-profile service principal be traced to a crown-jewel resource without first copying all of that access context into native Sentinel tables?
Yes. Here’s how I did it, using:
- An existing Sentinel workspace in the Defender portal
- An Azure Data Lake Storage Gen2 federation connector
- Two Delta-format context tables stored outside the analytics tier
- KQL to correlate federated context with native telemetry
- A custom graph to expose hidden privilege paths
- A workbook report to keep the findings operational
What Shipped in April 2026
Data federation lets you keep investigative context in external stores like ADLS Gen2, Azure Databricks, or Microsoft Fabric and query it from Sentinel without promoting everything into the analytics tier. Powered by Fabric, federated tables appear alongside native Sentinel data in the data lake. Federation itself doesn’t generate ingestion or Sentinel storage fees. You’re billed through Sentinel’s existing data lake query and advanced insights meters when you actually run analytics on federated data. Custom graph operations are billed separately under the Sentinel graph meter. Your underlying ADLS, Databricks, or Fabric storage still has its own platform costs.
Custom graphs let you model relationships over that data and visualize them in the Defender portal using Graph Query Language (GQL). Think principal-to-resource paths, group memberships, and entitlement chains. You author graphs in Jupyter notebooks via the Sentinel VS Code extension, then schedule graph jobs to materialize them for team access in the Defender portal.
Both features are useful for context that changes slower than event telemetry. Asset inventories, entitlement snapshots, historical relationship data, and low-fidelity signals that still matter during triage all fit this pattern.
How The Workflow Fits Together
The environment is intentionally small. One existing Sentinel workspace and just enough Azure infrastructure to answer the question:
| Component | Purpose |
|---|---|
| Existing Sentinel workspace | Defender-portal workspace and data lake target |
| ADLS Gen2 | Holds the Delta-format federation tables |
| Azure Key Vault | Stores the federation service principal secret |
| Service principal | Authenticates Sentinel to the ADLS source |
| Federated tables | Resource criticality and principal-to-resource access context |
| Custom graph notebook | Builds a graph for privilege-path analysis |
| Workbook report | Operational view of privileged paths and resource criticality |
The two federated tables are small and opinionated:
ResourceCriticalityidentifies which Azure resources matter mostPrincipalResourceAccessmodels who can reach those resources and how
The dataset includes a synthetic rogue identity so the investigation has an obvious attacker path:
shadow-sync-prod-sp- direct
Storage Blob Data Owneron the storage account - direct
Key Vault Secrets Officeron the crown-jewel vault
That’s enough to show the investigation pattern without inventing a giant fake dataset.
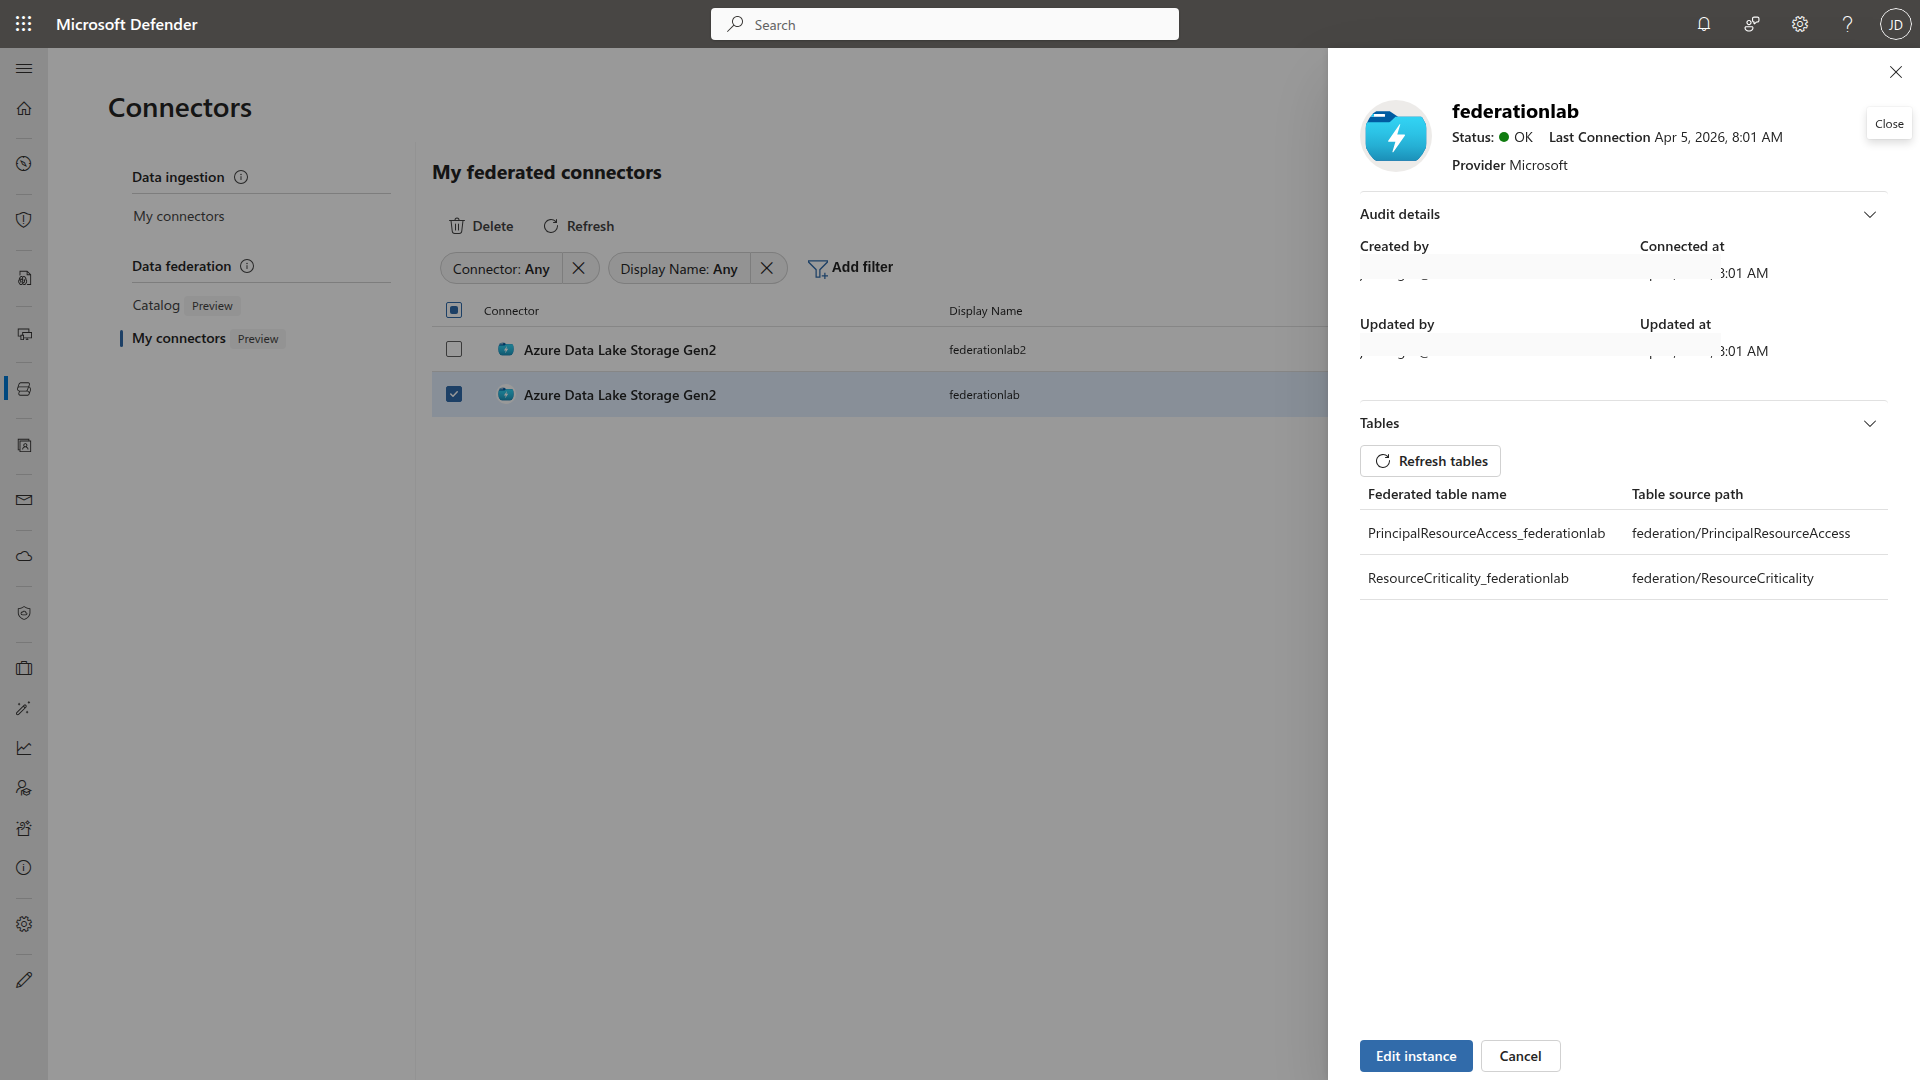
Configure the Federation Connector
From the Defender portal:
- Go to Microsoft Sentinel > Configuration > Data connectors
- Under Data federation, open Catalog
- Choose Azure Data Lake Storage
- Create a connector instance named
federationlab - Provide:
- application (client) ID
- Key Vault URI
- secret name
- ADLS URL
- Select the two demo tables from the ADLS source
Hunt with KQL First
First step. Confirm that Sentinel can join the federated context tables to answer the question that actually matters.
let ResourceCriticality = ResourceCriticality_federationlab;
let PrincipalResourceAccess = PrincipalResourceAccess_federationlab;
PrincipalResourceAccess
| where principalDisplayName == "shadow-sync-prod-sp"
| join kind=inner ResourceCriticality on resourceId
| project principalDisplayName, resourceName, criticality, accessRole, accessSource, detectionHint, riskLabel
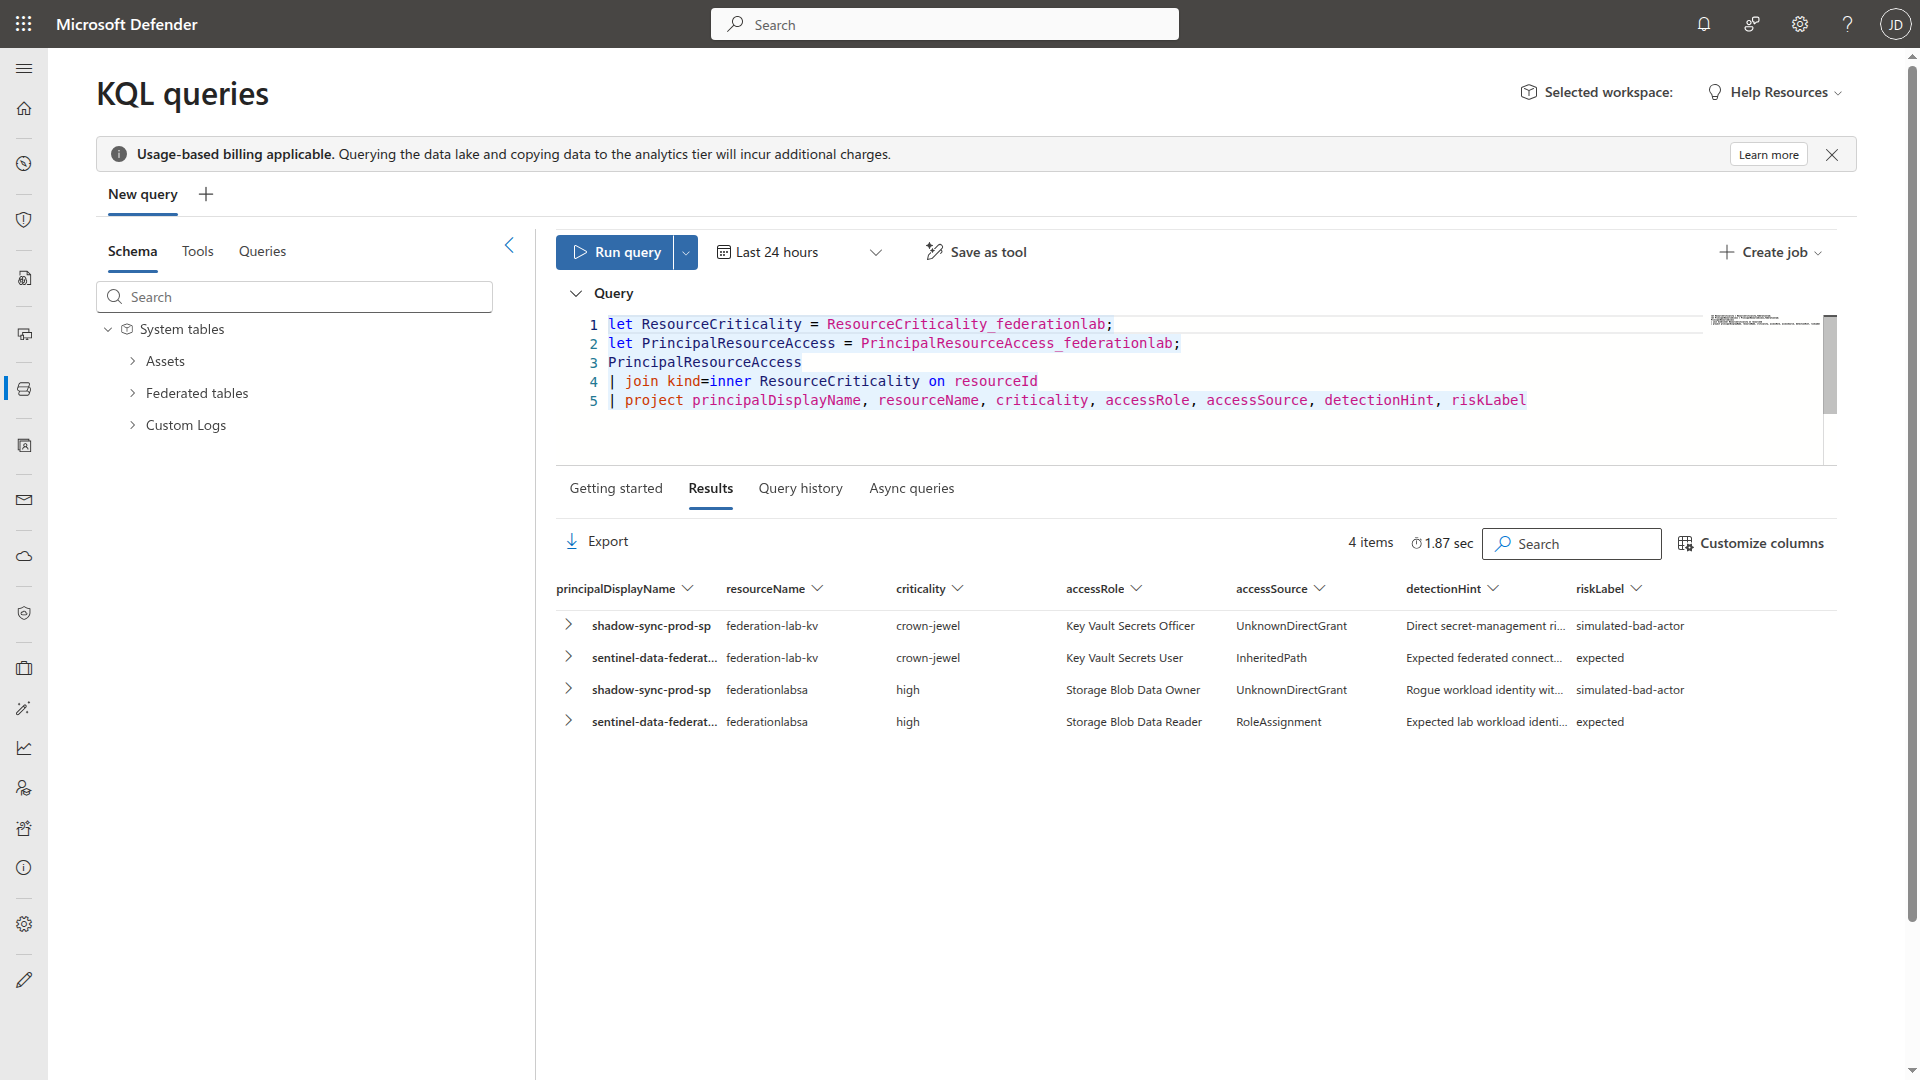
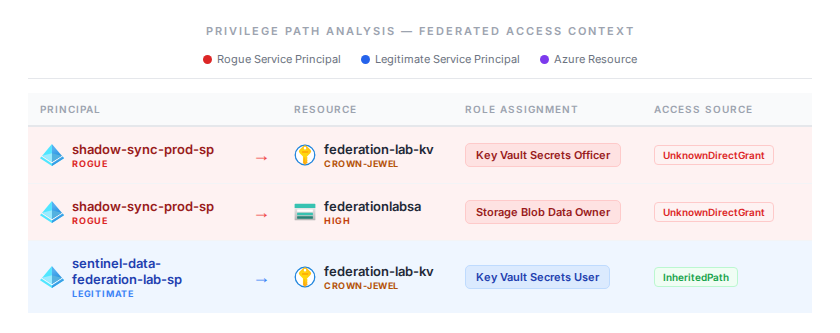
The results tell the story in four rows:
shadow-sync-prod-sphasKey Vault Secrets Officeron the crown-jewel vault andStorage Blob Data Owneron the storage account, both viaUnknownDirectGrant, flagged assimulated-bad-actor. That’s the rogue identity with direct, unexplained access to two high-value resources.sentinel-data-federation-lab-sphasKey Vault Secrets UserviaInheritedPathandStorage Blob Data ReaderviaRoleAssignment, both labeledexpected. That’s the legitimate lab workload identity with appropriate, traceable access.
The broader KQL pattern is just as useful. Remove the where filter and you get every principal with access to every critical resource. The full exposure map:
let ResourceCriticality = ResourceCriticality_federationlab;
let PrincipalResourceAccess = PrincipalResourceAccess_federationlab;
PrincipalResourceAccess
| join kind=inner ResourceCriticality on resourceId
| where criticality in ("crown-jewel", "high")
| summarize AccessRoles = make_set(accessRole), ResourceCount = dcount(resourceName) by principalDisplayName, riskLabel
| sort by ResourceCount desc
The graph is where this becomes easier to explain to another analyst or an incident owner.
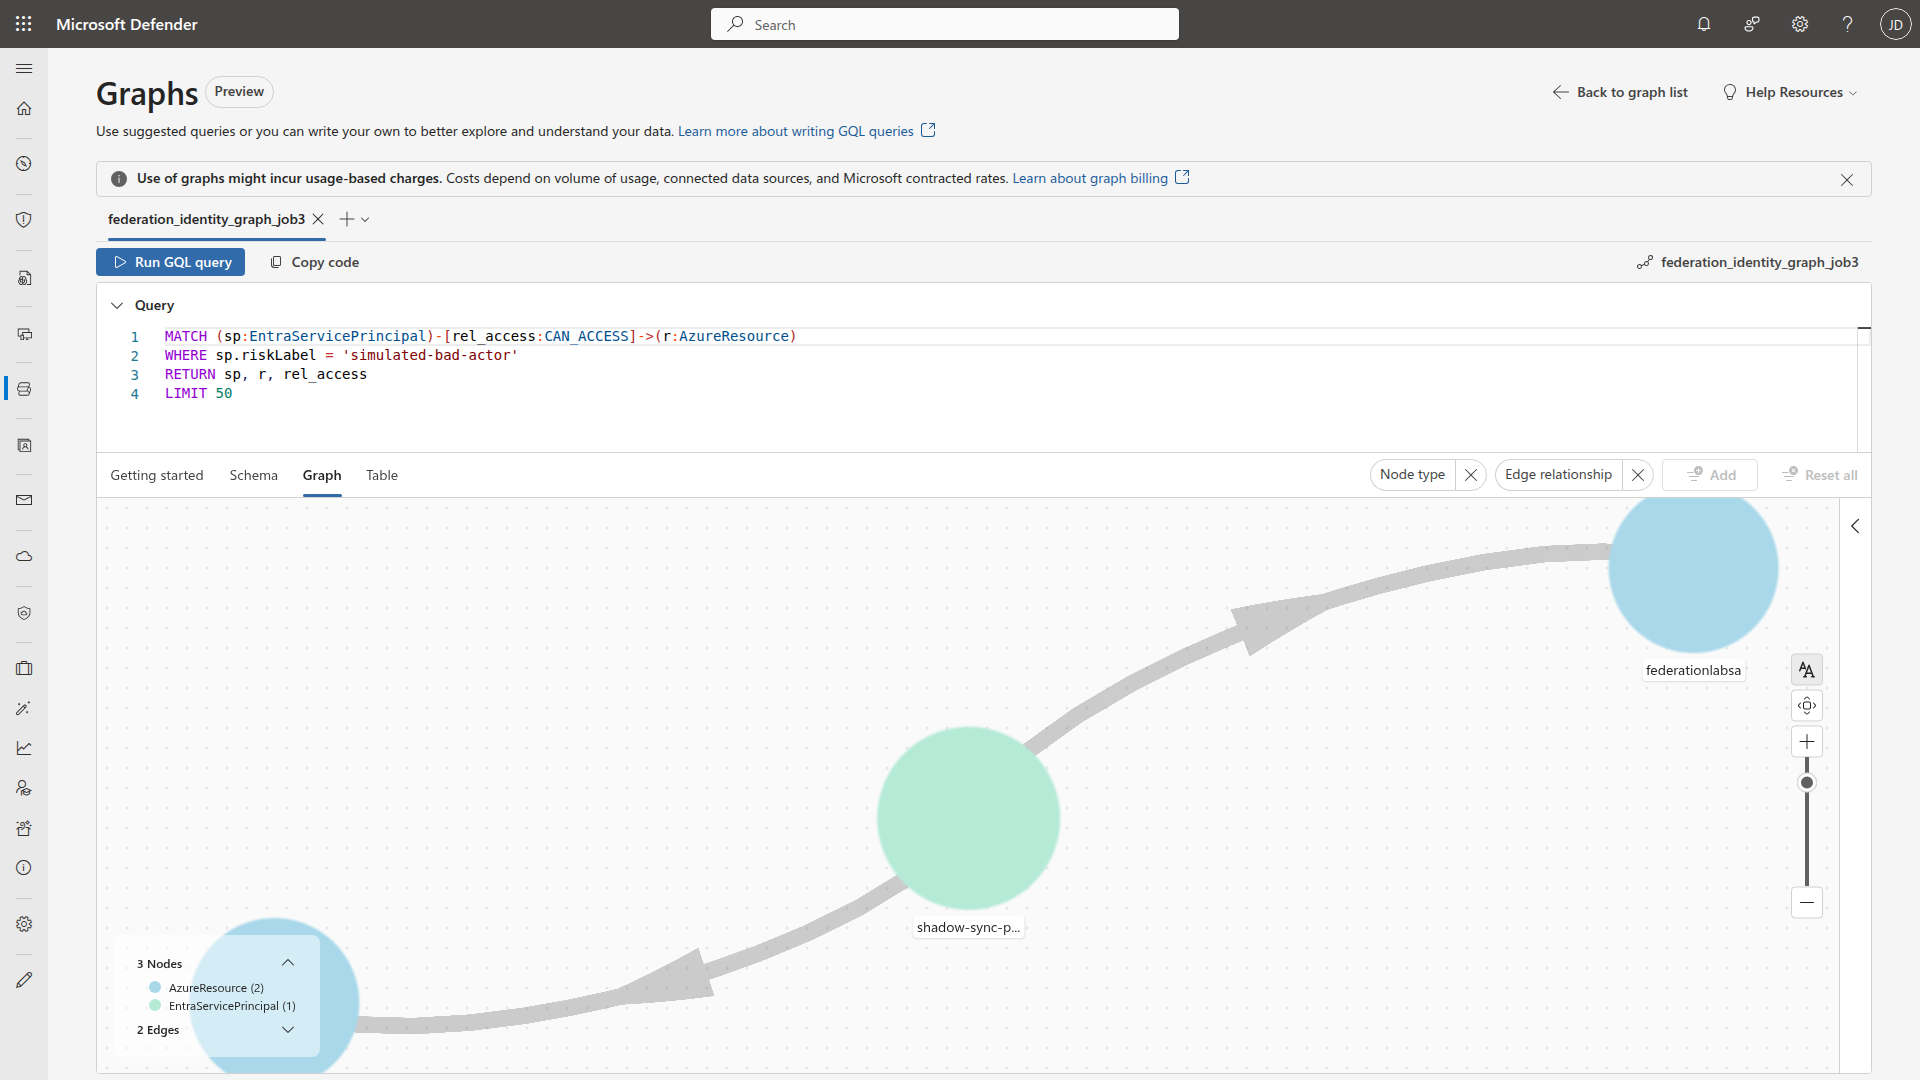
Build the Custom Graph
I built the graph using the Microsoft Sentinel VS Code extension and its graph builder Python library. You can use AI-assisted authoring or write the graph model code directly.
Three node types:
EntraServicePrincipalEntraUserAzureResource
And one primary edge:
CAN_ACCESS
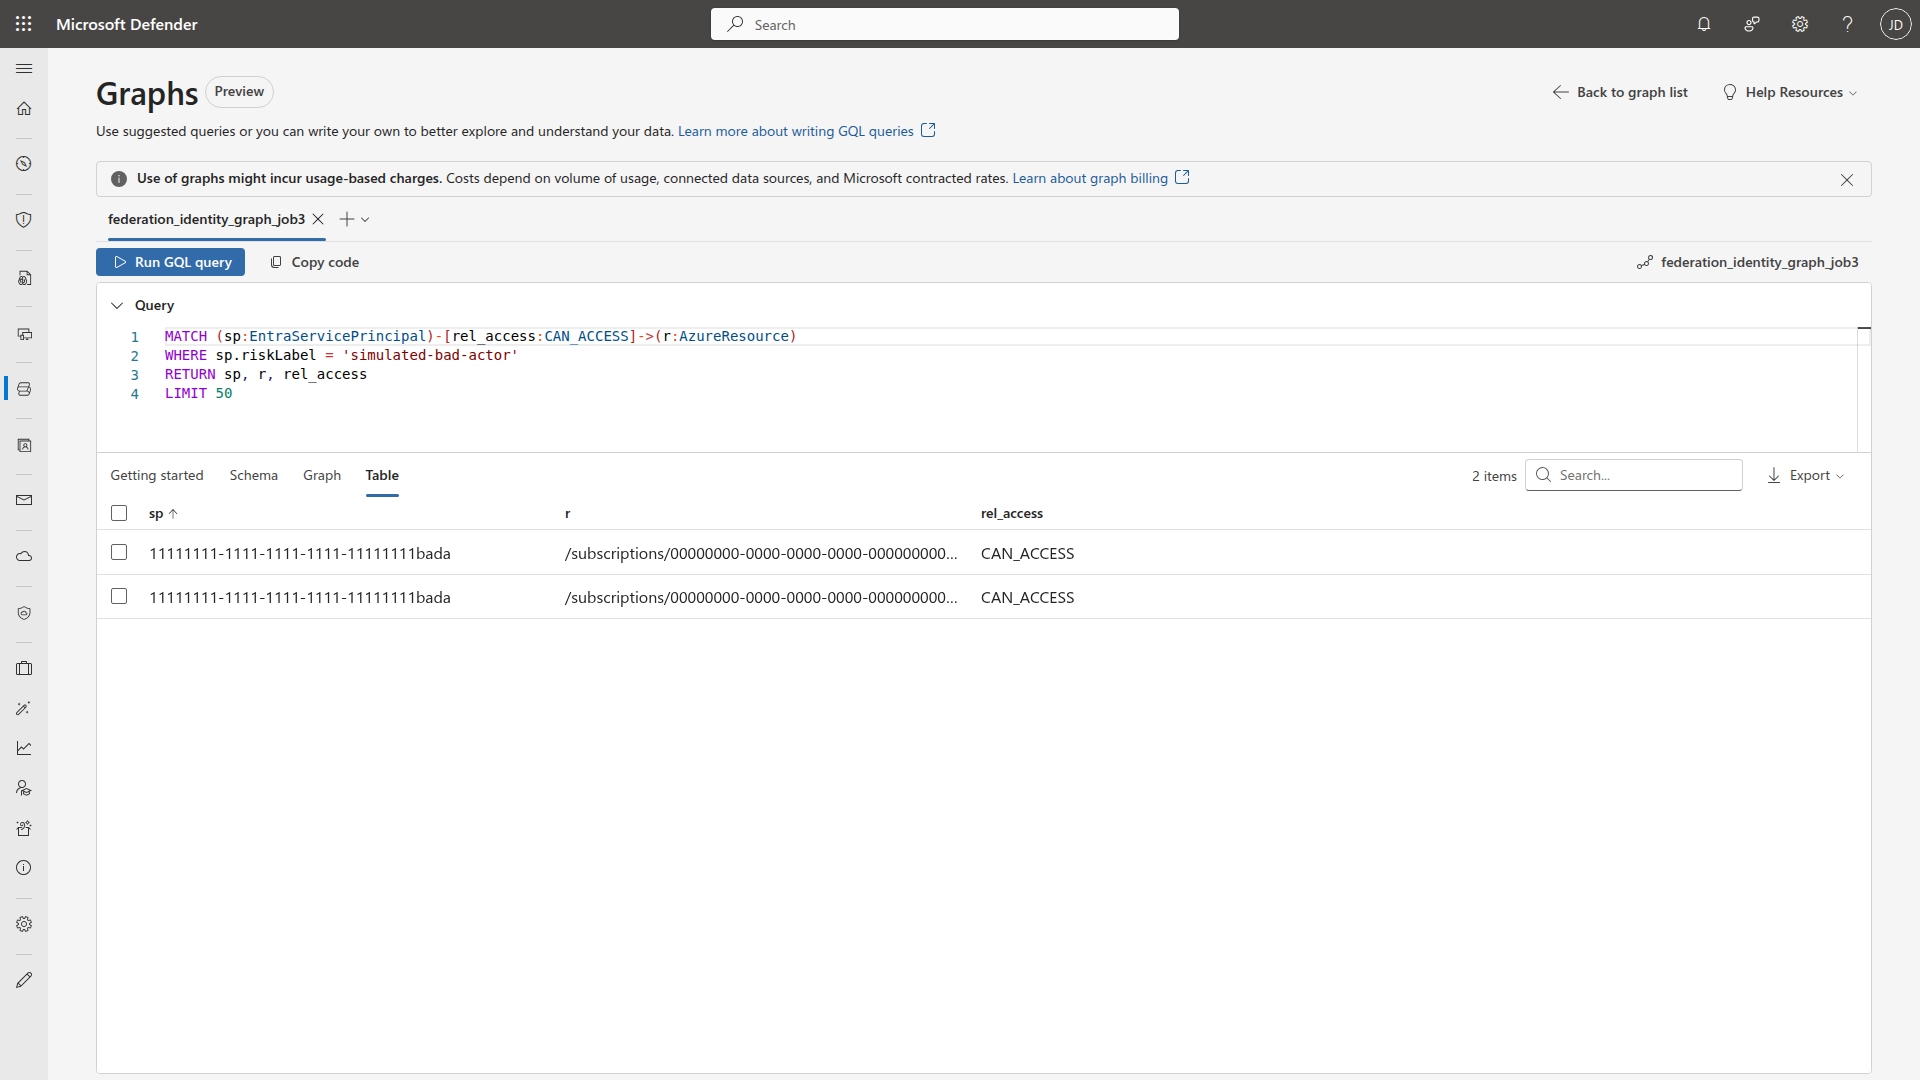
MATCH (sp:EntraServicePrincipal)-[rel_access:CAN_ACCESS]->(r:AzureResource)
WHERE sp.riskLabel = 'simulated-bad-actor'
RETURN sp, r, rel_access
LIMIT 50
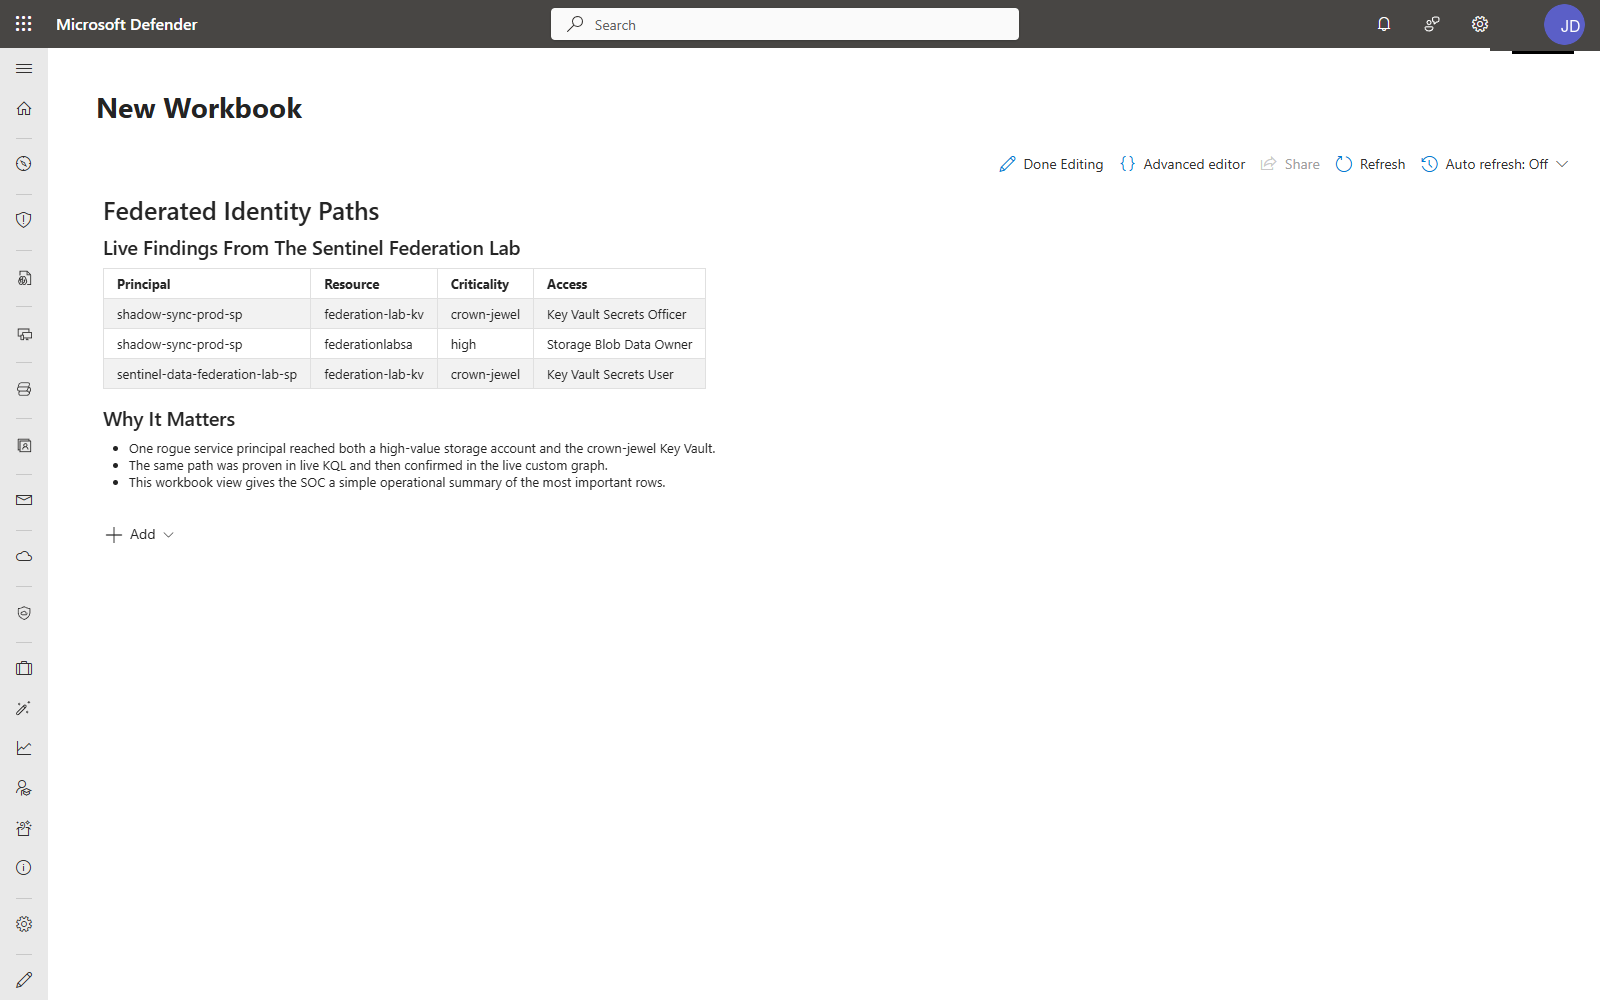
Add a Workbook Report
Creating workbook reports directly from data lake data entered public preview on April 1, 2026, the same release as federation and custom graphs. The workbook below isn’t a workaround. It’s a first-class capability that Microsoft is actively building into the data lake experience.
The workbook keeps the same findings usable after the initial investigation. Instead of rerunning the graph or the KQL join every time, the risky principal, sensitive resource, and access role stay visible in a format that fits day-to-day SOC operations.
The workbook KQL is the same federated join, shaped for an operational summary.
let ResourceCriticality = ResourceCriticality_federationlab;
let PrincipalResourceAccess = PrincipalResourceAccess_federationlab;
PrincipalResourceAccess
| join kind=inner ResourceCriticality on resourceId
| where criticality in ("crown-jewel", "high")
| project principalDisplayName, resourceName, criticality, accessRole, accessSource, riskLabel
| sort by riskLabel asc, criticality asc
The workbook includes:
- Federated Identity Paths. Table of every principal-to-resource access path, with criticality and role columns, sourced from the federated join.
- Why It Matters. Summary of key findings. Which rogue identities reached crown-jewel resources, how the path was validated, and what the SOC should watch.
This is a lightweight operational view, not a full dashboard. The goal is to keep the investigation findings visible without requiring an analyst to re-run queries every time the question comes up.
Limitations and Gotchas
- The federated source must be publicly reachable. Private endpoints are not supported yet.
- Key Vault networking must be set to allow public access from all networks during connector setup. You can restrict it after creation.
- The connector authenticates via service principal + Key Vault. The Sentinel platform identity (
msg-resources-*) needs Key Vault Secrets User on the vault. The ADLS service principal needs Storage Blob Data Reader. - Federation is read-only. You cannot write back to the federated source from Sentinel.
- New federated data can take up to 15 minutes to appear in KQL queries and up to 24 hours to show in notebooks.
- Table names include the connector instance name, for example
ResourceCriticality_federationlab. Validate the final names in your environment. - Graphs created in interactive notebook sessions are ephemeral. Schedule a graph job to materialize the graph for team access in the Defender portal.
- Graph API usage is billed via the Sentinel graph meter. Federated analytics are billed through the data lake query and advanced insights meters. Graph build and query workflows can also incur Advanced Data Insights and data lake storage charges for node/edge preparation. Your underlying ADLS/Databricks/Fabric platform costs are separate.
- Graph authoring flows best through the Microsoft Sentinel VS Code extension.
- Your workspace must be onboarded to the Sentinel data lake before federation will work.
- Customer-Managed Keys (CMK) are not supported. Workspaces using CMK for encryption can’t access data lake experiences, including federation and graphs.
- Maximum 100 federation connector instances per tenant.
Cleanup
If you reproduce this:
- Delete the ADLS Gen2 storage account that held the federated context tables
- Delete the Key Vault secret and the service principal
- Remove the federation connector instance
Leave the Sentinel workspace alone unless you built a disposable one for testing.
Key Takeaways
- Federation answers the cost question. The biggest pushback on enriching Sentinel investigations is ingestion cost. Federation lets you query the context without paying to store it in the analytics tier.
- Small, opinionated context tables beat large data dumps. Two tables with the right columns answered a higher-value question than another pile of raw RBAC exports would have.
- Graphs make privilege paths explainable. A flat KQL result set tells you the answer. A graph tells the story. To another analyst, to an incident owner, to leadership.
- Materialize your graphs. Interactive notebook graphs are ephemeral. Schedule a graph job so the investigation is available to the team, not just to whoever ran the notebook.
- Start with the investigation question, not the feature. “Can this SP reach the vault?” is more useful than “let me try federation.” Work backwards from the triage question you actually need to answer.
Resources
- What’s new in Microsoft Sentinel: RSAC 2026
- Announcing public preview of custom graphs in Microsoft Sentinel
- Custom graphs in Microsoft Sentinel — Overview (preview)
- Set up federated data connectors in Microsoft Sentinel data lake
- Run notebooks on the Microsoft Sentinel data lake
- Visualize graphs in Microsoft Sentinel
- Graph REST APIs for custom graphs (preview)
Have you started using Sentinel data federation or custom graphs? I’d like to hear what investigation patterns you’re building with them — especially if you’re federating non-Microsoft context like CMDB or asset inventory data. Find me on LinkedIn or my other socials linked below.

Jerrad Dahlager, CISSP, CCSP
Cloud Security Architect · Adjunct Instructor
Marine Corps veteran and firm believer that the best security survives contact with reality.
Have thoughts on this post? I'd love to hear from you.